


How do you objectively know if your field service company is headed in the right direction? You don’t if you aren’t collecting the right data and drawing the right conclusions from it. That’s why field service KPIs are so critical in steering your business where you want it to go.
This article discusses how to choose the metrics that will serve as key performance indicators (KPIs) for your business, gives you 40 suggestions, and offers a couple of ideas on how to efficiently track the KPIs you choose.
- What are field service management KPIs & metrics?
- Why tracking the right field service metrics is so important to your business’ success
- Planning and choosing the most important field service KPIs to track
- 40 field service metrics & KPIs to monitor, track, and analyze
- How to set up KPIs from your field service reporting
- How to leverage field service management dashboards for efficient KPI analysis
- How BuildOps helps track field service KPIs
First, we’ll take a closer look at what field service management KPIs are and what they can tell you about your company.
What exactly are field service management KPIs & metrics?

Image Source: BuildOps
Field service management KPIs and metrics are data that measure the quality and efficiency of a field service company’s operations. They indicate how a company’s processes have changed over time (metrics), as well as how close the company is to meeting its goals (KPIs).
An example field service metric might be the on-time arrival rate (number of times techs arrived on time divided by total number of calls times 100), while an example field service KPI might be to increase on-time arrival rates to 90% or higher company-wide this year.
Why tracking the right field service metrics is so important to your business’ success

Image Source: BuildOps
Field service metrics and KPIs are how your company measures how well it’s doing. They tell you how close you are to meeting your goals, as well as where the problem areas in your operations might be.
If it helps, think of a field service KPI as a map, and a field service metric as a compass. KPIs help you figure out where you are relative to where you want to be. Metrics help you determine if you’re going in the right direction or taking the most efficient route to get where you want to go.
Field service KPIs help contractors and companies understand:
- Operational efficiency – Is your company making the best use of its resources?
- Productivity & performance – How much are you getting done, and are you doing quality work?
- Customer satisfaction – How do your customers feel about the quality of work you do and the way you treat them?
- Sales & revenue – Are your pricing strategies and marketing efforts capturing the most opportunities to profit?
First, though, you have to determine which metrics to track, why you want to measure them, and how to analyze them. We’ll talk more about that in the next section.

Planning and choosing the most important field service KPIs to track
In general, you should have a goal (or set of goals) in mind before you start thinking about which field service management metrics to track. Then you can figure out which KPIs you need to measure to tell if you’re getting closer to or farther from your goals. And once you know that, you can think about how to measure those KPIs in a way that gets you the data you need.
How to choose ideal field service metrics as KPIs
When selecting the most impactful KPIs, the “SMART” system is a popular framework to follow. It directs you to choose metrics that are:
- Specific: You can form a concrete plan to improve these metrics, and know how improving them will help your company
- Measurable: Data you can count and compare over time to tell if you’re closer to, or farther from, your goals
- Achievable: You’re able to set realistic benchmarks with these metrics to tell whether or not you’re on track
- Relevant: The metrics align with your business objectives, both short-term and long-term
- Timely: You’re able to track changes in the metrics over specific time frames to check progress
What you need to consider before setting up your system
When setting up a field service metrics & KPIs analysis system, you should also consider the following:
- Where are you getting the data from? – Ideally, your data should come directly from monitoring your internal operations and your targeted interactions with customers (on-site meetings, phone calls, emails, surveys, etc.). This allows you to get the most relevant information for assessing your company’s performance.
- Who needs access to the reporting? – Think about who is going to be in a position to measure and report on the kinds of metrics you want to track, and make sure they have what they need to contribute to the reporting.
- What are your goals, and who is accountable to them? – Set specific milestones based on your most urgent objectives. Then decide who’s responsible for seeing to it that those benchmarks are met, whether that’s an individual employee, a team, or a whole department.
- Are you using software, and if so, what features does it have? – Field service management software is a great way to make managing your field service company more efficient if you understand its capabilities and how to take advantage of them. That goes for KPI analysis as well as any other part of your operations.
- How can you simplify & automate your process? – Reporting is administrative work that takes away from time you’d rather be doing field service jobs and growing your business. So find ways to minimize the time it takes with software-powered shortcuts like dashboards, templates, auto-fill, and AI writing assistance.

40 field service metrics & KPIs to monitor, track, and analyze
We’ve organized our field service KPI examples into four main categories, depending on what area of your business they give you insight into. For each metric, we’ve also indicated the roles that should be reporting on it, using it to take action, or both. Finally, we explain why the metric is worth measuring.
Field service metrics for operational efficiency
These metrics relate to how well you’re using your company’s resources. Improving these KPIs saves you time and money so you can get more done, the right way, with less waste.
1. Service Call Request Volume

How to Calculate: Total the number of service call requests received in a specified period of time.
Who Needs To Measure This: Dispatcher/Scheduler, Sales / Revenue Ops, Maintenance
Why This KPI Is So Important: Service Request Volume is how frequently your company gets service call requests. It’s a measure of how busy your company is. If it’s low, you may need to look at internal factors: pricing, quality of service, brand exposure, and so on. You may need to shift resources towards more marketing. On the other hand, if you have a high volume of service requests, you may need less resources in marketing and more in supporting actual field operations.
2. Average Time to Site

How to Calculate: Divide the total time it takes for your technicians to reach job sites by the total number of service calls you have scheduled over the same time period.
Who Needs To Measure This: Tech, Dispatcher/Scheduler, Maintenance
Why This KPI Is So Important: Average Time to Site measures the average amount of time it takes a tech assigned to a job to get from their dispatch point – whether that’s your headquarters, another job site, or somewhere else – to a job site. Faster transit times make customers happier and may reduce fuel costs. If this number is high, it may point to a need to optimize your service call routes so your techs don’t have to travel as far between job site visits.
3. On-Time Arrival Rate

How to Calculate: Divide the number of times your techs arrived at job sites on time by the total number of service calls you scheduled over the same time period, then multiply that number by 100.
Who Needs To Measure This: Dispatcher/Scheduler, Tech, Maintenance
Why This KPI Is So Important: On-Time Arrival Rate is the rate at which technicians arrive at job sites before or at the times scheduled for the corresponding service calls. Similar to Average Time to Site, customers consider it good service when you arrive at a job site on time (or early). If this number is low, it could point to inefficient scheduling, dispatching, or route planning. You may need to do things like spread your workload out among more techs, or track your fleet to see if techs are taking the most efficient routes to job sites.
4. Tech-to-Dispatcher Ratio

How to Calculate: Divide the total number of technicians you have on staff by the total number of dispatchers you have on staff. The ratio is X-to-1.
Who Needs To Measure This: Tech, Maintenance, Dispatcher/Scheduler
Why This KPI Is So Important: Tech-to-Dispatcher Ratio measures the average number of techs each of your dispatchers is responsible for. It’s inefficient for both processes and costs to have dispatchers manage techs on a one-to-one (or similar) basis. Refining scheduling and dispatching procedures – perhaps through the use of software – should let you reduce the number of dispatchers you have on staff while still allowing them to handle all of your techs at once.
5. Vehicle Utilization Rate

How to Calculate: Divide the total active vehicle operating time by the total time vehicles could potentially be operational.
Who Needs To Measure This: Tech, Dispatcher/Scheduler, Maintenance
Why This KPI Is So Important: Vehicle utilization rate measures the amount of time your vehicles are active, helping you determine how much time they spent helping you service calls and how much time they spend inactive. Using vehicles inefficiently leads to excess fuel costs and longer travel times – the latter of which can lead to late arrivals and, in turn, unsatisfied customers. Consider reducing the number of vehicles you own, or at least taking steps to make their use more efficient.
For example, pre-stock vehicles with the parts you’ll need for jobs – ideally jobs you do often – so techs don’t have to take detours to load up. Also, consider scheduling similar jobs one after another, assigning the same vehicle and tech to them. That way, techs will arrive at the job site with the vehicle equipped to do the job, without having to make pit stops to switch vehicles or techs. Don’t always use the same vehicle for every job, though; that’s inefficient, too.
6. Average Travel Time

How to Calculate: Divide the total amount of time your technicians spend traveling between job sites by the total number of service calls you get over the same time period.
Who Needs To Measure This: Tech, Dispatcher/Scheduler, Maintenance
Why This KPI Is So Important: Average Travel Time represents approximately how much time each of your techs spends commuting from one job site to the next between service calls. If this metric is high, it can point to inefficient scheduling, dispatching, or vehicle use. Consider adjusting your scheduling and dispatching processes so that techs can travel between job sites that are closer together, or at least take the fastest route between each one. It can also be useful to employ fleet tracking so you can make sure your techs are taking the correct routes.
7. Service Call Request Backlog

How to Calculate: Total the number of unhandled service call requests.
Who Needs To Measure This: Tech, Dispatcher/Scheduler, Maintenance
Why This KPI Is So Important: Service Request Backlog refers to service calls your company hasn’t completed over the time period in which they were scheduled. A large backlog could point to poor technician use or performance, among other inefficiencies. It can affect other metrics related to maintenance work (as equipment may get damaged, malfunction, or break down before you get to servicing it) and customer satisfaction (as they won’t be happy to have to wait on you to fulfill their request).
8. Average Number of Daily Jobs Completed

How to Calculate: Divide the total number of jobs you complete over a given time period by the number of days in that same time period.
Who Needs To Measure This: Tech, Dispatcher/Scheduler, Maintenance, Sales / Dev Ops
Why This KPI Is So Important: This measures approximately how many service calls you’re able to finish in a day, and many different things can affect it. It could relate to the overall number of service calls you’re able to book. Or it could have to do with how efficiently you schedule service calls and dispatch techs to them, and how efficiently techs complete jobs. Look into whether this metric denotes a marketing issue, a field service management issue, or both for your company.
9. Reschedule Rate

How to Calculate: Divide the number of times you had to reschedule service calls over a given time period by the total number of service calls you had scheduled over that same time period, then multiply the result by 100.
Who Needs To Measure This: Dispatcher/Scheduler
Why This KPI Is So Important: Reschedule Ratio is a measure of how often you have to reschedule service calls, either because of a scheduling conflict or because a dispatching error makes it so a technician doesn’t get to a job site on time (or at all).
Customers don’t like it when you have to reschedule their service calls. You can by-and-large solve this problem by streamlining your scheduling and dispatching – potentially by using software – so techs are sent to the right job site at the right time, and you don’t end up scheduling more than one job for the same tech at the same time. It can also be helpful to take customer feedback into account, so you know the most convenient time to schedule a service call for them.
10. Returned/Unused Parts Rate

How to Calculate: Divide the number of parts that go unused or are returned to the manufacturer by the total number of those kinds of parts ordered over a specific time period, then multiply the result by 100.
Who Needs To Measure This: Tech, Maintenance
Why This KPI Is So Important: Returned/Unused Parts Rate reflects the rate at which purchased parts are brought on service calls, but aren’t used – or are even returned to the manufacturer – because they weren’t needed for jobs. While it’s good to have extra parts in case of emergencies, a high rate here means you’re wasting money on parts you’ll likely never end up using. You should look at your supplier contracts and inventory management processes to see if you can find a better balance between being prepared and being efficient/cost-effective.
11. Employee/Contractor Turnover

How to Calculate: Divide the number of employees who leave your company over a given time period by the total number of employees you had at the start of that time period, then multiply that number by 100.
Who Needs To Measure This: Tech, Maintenance
Why This KPI Is So Important: Turnover measures the average rate at which employees leave your company. Having to constantly replace employees is inefficient and slows down your productivity. You lose experienced employees while having to spend resources on getting incoming employees up to speed. Try to avoid this by modifying your internal processes so employees get paid fairly and on time, and spend more time working out at job sites than doing administrative work.
12. Service Level Agreement (SLA) Compliance Rate

How to Calculate: Divide the number of service requests you complete within each one’s respective SLA terms by the total number of service calls you schedule over the same time period, then multiply the result by 100.
Who Needs To Measure This: Tech, Dispatcher/Scheduler, Maintenance, Sales / Dev Ops
Why This KPI Is So Important: SLA Compliance Rate reflects the average rate at which you’re able to complete a service request within the parameters set out in the Service Level Agreement (SLA) you sign with the customer. Basically, it’s a measure of how often you do what you tell the customer you’re going to do, the way you tell them you’re going to do it.
Meeting or exceeding SLA guidelines builds trust with customers that you can reliably get jobs done. If this rate is low, it could be because of a number of factors. Your scheduling and dispatching could be inefficient, your techs could not be working productively enough, or your salespeople may be making unrealistic promises.
13. Preventative vs. Reactive Service

How to Calculate: Divide the total time your company spends on maintenance jobs by the total time you spend on repair jobs over a given time period. The ratio is X-to-1.
Who Needs To Measure This: Tech, Maintenance
Why This KPI Is So Important: Preventative vs. Reactive Service refers to the ratio of time you spend maintaining equipment so it doesn’t break down to the time you spend repairing equipment that’s already broken. This KPI can be important from a sales & revenue perspective, indicating that techs are missing upselling opportunities to maintain equipment after repairing it.
Or it could be important in the general sense of highlighting what kind of work your company gets the most. This can help you tailor your inventory and resource management to be prepared to do that kind of work more often.

Field service performance metrics & productivity KPIs
Field service performance metrics are more about the work your techs & maintenance people do in the field. They measure things like how quickly they get their work done, as well as how long that work lasts before it requires repair, replacement, or maintenance.
14. Technician Utilization Rate

How to Calculate: Divide the total amount of time your technicians spend on billable tasks by the total amount of time your techs are on duty over the same time frame, then multiply that number by 100.
Who Needs To Measure This: Tech, Maintenance, Dispatcher/Scheduler
Why This KPI Is So Important: Technician Utilization Rate measures how much of a tech’s on-duty time is spent actually doing repair or maintenance work on service calls, as opposed to other things (traveling between job sites; doing administrative work; waiting for supplies or other techs to arrive at a job site; or idling).
Ideally, you want your techs to be working as efficiently as possible so they can quickly get from one service call to the next. If they aren’t, investigate whether that’s an issue with internal process efficiency, fleet management & route optimization, scheduling & dispatching effectiveness, or a tech’s own training & productivity.
15. On-Time Completion Rate

How to Calculate: Divide the number of service calls completed on time by the total number of service calls completed over the same time frame, then multiply that number by 100.
Who Needs To Measure This: Tech, Maintenance, Dispatcher/Scheduler
Why This KPI Is So Important: On-Time Completion Rate is the percentage of service calls that your techs complete within the estimated time frame. Although you can’t help it if unexpected issues come up during a job, you often inconvenience customers when you stay longer for a job than you need to. It also puts you behind if you have another service call to get to right after that.
As for why this happens, it could be a dispatching problem that results in techs arriving late to job sites. Or it could be your technicians not completing their work efficiently enough.
16. Number of Jobs Per Technician

How to Calculate: Divide the number of service calls you completed over a given time period by the number of technicians you had during the same time period.
Who Needs To Measure This: Tech, Maintenance, Dispatcher/Scheduler
Why This KPI Is So Important: This metric gives an average measure of how many jobs each of your techs is able to finish in a day. It can give insight into how efficient your techs are working, and maybe also how effective your scheduling & dispatching processes are.
However, bear in mind that variables such as the kinds of jobs each of your techs specialize in, as well as how far away job sites are, can affect this KPI. So be sure you’re measuring data that’s actually comparable.
17. Mean Time to Complete

How to Calculate: Divide the total time your technicians spend on service calls by the total number of service calls you complete over the same time period.
Who Needs To Measure This: Tech, Maintenance, Dispatcher/Scheduler
Why This KPI Is So Important: Mean Time to Complete measures the average amount of time it takes a tech to complete a service call, from when they’re dispatched to when they pack up and leave the job site. Mainly, this metric is useful for measuring tech efficiency at finishing jobs. Again, though, certain jobs can, by nature, take longer than others. So be sure to make comparisons between similar jobs when analyzing.
This metric can also help with scheduling and dispatching. It allows dispatchers to know how long a certain type of job will usually take, and which techs will likely be able to complete it on time.
18. Mean Time to Repair (MTTR)

How to Calculate: Divide the total time your techs spend on service calls (from dispatch to packing up) by the number of repair service calls you complete over the same time period.
Who Needs To Measure This: Tech, Maintenance, Dispatcher/Scheduler
Why This KPI Is So Important: Mean Time to Repair is a similar metric to Mean Time to Complete, but focuses specifically on repair jobs (as opposed to installation or maintenance jobs). It’s the average amount of time it takes your techs to complete repair service calls.
This KPI is important for the same reasons as Mean Time to Complete is, but allows for comparing similar metrics by focusing on one job type. Specifically, it lets you investigate if long repair times are caused by common problems your techs run into at job sites, or just techs not working efficiently enough.
19. Mean Time Between Failures (MTBF)

How to Calculate: Divide a piece of equipment’s total uptime by the number of times it breaks down.
Who Needs To Measure This: Tech, Maintenance
Why This KPI Is So Important: Mean Time Between Failures is the average amount of time a piece of equipment your techs work on stays functioning before it breaks down and needs to be repaired or replaced. If a piece of equipment breaks down frequently, it could point to a couple of things. One could be that your techs and maintenance people aren’t providing high enough quality work. Or, it could mean the equipment itself – or at least a part of it – is poorly designed and needs to be replaced.
20. Repeat Visit Rate

How to Calculate: Divide the number of service calls that are repeat visits (either to fix an unresolved issue or to finish previous work) by the total number of service calls you schedule over the same time period, then multiply that number by 100.
Who Needs To Measure This: Tech, Maintenance, Dispatcher/Scheduler
Why This KPI Is So Important: Repeat Visit Rate is the percentage of service calls that result from an initial visit not being able to immediately resolve a problem. A high rate can indicate your techs aren’t providing high enough quality service (if an issue they supposedly fixed persists) or working efficiently enough (if they have to return to the same job site to finish work). In either case, they may need additional training.
However, it could also point to inefficient scheduling and dispatching practices. A tech could be booked so full that they don’t have enough time in the day to properly finish all the jobs they’re dispatched to. Or a tech could not be taking the fastest routes between job sites, spending extra time traveling that they could be spending doing actual service work.
21. First-Time Fix Rate (FTFR)

How to Calculate: Divide the number of service calls that don’t require a follow-up visit (not including maintenance) by the total number of service calls you schedule in that time period, then multiply that number by 100.
Who Needs To Measure This: Tech, Maintenance, Dispatcher/Scheduler
Why This KPI Is So Important: Basically the opposite of Repeat Visit Rate, First-Time Fix Rate is the percentage of service calls where a technician completes their work and resolves any issues in a single visit. A high FTFR means your techs are providing efficient, quality service. It also means your dispatchers are scheduling service calls and assigning techs to them efficiently, giving your techs enough time to do their best work.
22. Average Dispatcher-Technician Contact

How to Calculate: Divide the number of contact events (phone calls, text messages, etc.) between techs and dispatchers – or the amount of time spent on them – by the number of service calls you booked over the same time period. You may also want to measure this metric by each specific contact method.
Who Needs To Measure This: Tech, Maintenance, Dispatcher/Scheduler
Why This KPI Is So Important: This KPI measures how often, on average, your field techs contact your dispatchers (or other employees) to get information or solve issues. If it’s high, it may point to a need to better train your techs so they can problem-solve on their own. Or it may mean investing in more efficient communication methods, such as video calling or real-time updates. This lets dispatchers monitor techs more effectively and exchange more information per contact, requiring less back-and-forth communication to solve a problem.
23. Equipment Uptime

How to Calculate: Divide the amount of time a piece of equipment is operational by the total amount of time it was planned to be working properly, then multiply the result by 100.
Who Needs To Measure This: Tech, Maintenance
Why This KPI Is So Important: Equipment Uptime is how often a piece of equipment is in use relative to how long it stays functioning. If this KPI is high, it shows your techs are giving reliable service on equipment so that it can run continuously for long periods of time. This can be especially important to certain industrial customers, in that a critical piece of equipment doesn’t fail at a bad time and cost them business.
24. Contract Uptime

How to Calculate: The total amount of time all services were available divided by the total time of your contract, times 100.
Who Needs To Measure This: Tech, Maintenance
Why This KPI Is So Important: Contract Uptime measures the percentage of time a piece of equipment functions correctly relative to the amount of time it’s covered by a service agreement. Similar to Equipment Uptime, it indicates how reliably your techs are able to install, repair, and maintain a piece of equipment.
If this metric is low, it could point to needing to train your techs more to provide better quality service. Or you could need to revise your installation, repair, or maintenance processes to be more effective. It could also mean that the equipment or the parts that make it up are poorly designed, and should be replaced.
25. Emergency Parts Order Cost

How to Calculate: Count the total amount you spend on part orders to make emergency repairs. You can also divide the result by the number of “emergency” service calls you get over the same time period to determine how much each one costs you.
Who Needs To Measure This: Tech
Why This KPI Is So Important: By defining what an “emergency” situation is and budgeting for the necessary parts ahead of time, your company can avoid extra expenses by having to rush-order parts when an emergency does come up.
Sales & revenue field service management metrics
These field service KPI metrics have to do with how profitable your business is: how much it’s costing to acquire new customers through marketing, as well as to dispatch technicians for service calls, compared to how much money those service calls are bringing in. Your sales & revenue teams are responsible for most of them, though some can be helped by your techs seizing additional on-site selling opportunities, or by your overall operation being more efficient.
26. Average Service Call Cost

How to Calculate: Divide the total expenses for service calls by the number of service calls you booked over the same time period.
Who Needs To Measure This: Tech, Maintenance, Dispatcher/Scheduler
Why This KPI Is So Important: Average Service Call Cost is the average amount it costs your company to complete one service call. Expenses can include paying employee wages, ordering necessary parts and equipment, fueling and maintaining a fleet, and so on. You want to minimize the amount that service calls cost you so you can keep more revenue (i.e. profit) from them. That comes down to making your operations more efficient by optimizing your service processes: scheduling, route planning, tech training, inventory management, and so on.
27. Average Service Call Value

How to Calculate: Divide the total revenue earned through service calls by the number of service calls booked over the same time period.
Who Needs To Measure This: Sales / Rev Ops
Why This KPI Is So Important: Average Service Call Value is the average amount of revenue each service call brings in. This can include not only the initial estimate, but also any additional work that ends up being done and any work booked for the future (i.e. further repairs, replacements, or maintenance).
It measures how much total money you’re making off jobs. You can increase it by adjusting your prices, training your techs on how to seize upselling or cross-selling opportunities at the end of service calls, or improving efficiency to avoid service calls that cost you money (i.e. they need to be rescheduled, or they’re repeat visits because the job wasn’t done right the first time).
28. Average Technician Revenue

How to Calculate: Divide the total revenue you earn over a period of time by the number of techs you have on staff during that period.
Who Needs To Measure This: Sales / Rev Ops, Tech, Maintenance
Why This KPI Is So Important: Average Revenue per Technician is the average amount of money each of your techs makes you. It helps you determine if the number of techs you have on staff balances out with the amount of money you’re making.
Generally, a higher number is better, but it could also mean your techs may be overworked and you could afford to hire a few more. A low number could mean you aren’t pricing your services right, you aren’t using your techs efficiently enough, or you have high employee turnover (so incoming techs are inexperienced and need time to train instead of do revenue-generating work).
29. Service Call Profitability

How to Calculate: Subtract the total expenses of completing service calls from the revenue earned by those same service calls.
Who Needs To Measure This: Sales / Rev Ops, Tech, Maintenance, Dispatcher/Scheduler
Why This KPI Is So Important: Job Profitability is how much money you make off service calls after factoring in the costs involved. This KPI tells you how much extra money you get from jobs to grow your business with. If it isn’t very high, you need to adjust your pricing strategies, find ways to cut costs (in terms of employee salaries, supply purchasing, marketing efforts), or make your processes more efficient.
30. Customer Acquisition Cost (CAC)

How to Calculate: Divide the total amount of money you spend on marketing over a period of time by the number of unique new customers you complete service calls for over the same time period.
Who Needs To Measure This: Sales / Rev Ops
Why This KPI Is So Important: CAC is the average amount of marketing spend it takes to have a new customer book a service call. It tells you how effective your marketing efforts are. If it’s high, you need to adjust your strategies to use different channels, or tailor your messaging to more specifically target certain audiences. You may also want to abandon campaigns that aren’t bringing in enough conversions relative to their cost.
31. Contract Attachment Rate

How to Calculate: Divide the number of customers with whom you have a contract at a particular point in time by your total number of customers at that time. Then multiply that number by 100.
Who Needs To Measure This: Sales / Rev Ops, Tech, Maintenance
Why This KPI Is So Important: Contract Attachment Rate is the percentage of your active customers who are currently under a service agreement. It’s a measurement of how many customers are satisfied enough with your service to stay with you for additional maintenance. If it’s low, try making your service offerings more attractive, or train your techs and customer service reps on how to upsell or cross-sell.
32. Revenue Leakage

How to Calculate: Subtract the amount of revenue you make over a period of time from the amount you forecasted you’d make based on your standard pricing.
Who Needs To Measure This: Sales / Rev Ops, Tech, Maintenance
Why This KPI Is So Important: Revenue Leakage is the amount of money you lose when you forget to bill customers, or bill them less than what your services are worth. And you don’t want billing errors costing your company money. Try investing in field service invoice software that lets your techs invoice – or even capture payments – at the point of sale, or even automatically calculate invoice totals. You may also need to work with your billing team on more effectively following up on unpaid invoices.
33. Service-to-Cash Rate

How to Calculate: Divide the total amount of time it takes after each service call for the customer to pay their invoice by the total number of invoices you send out over that same time period.
Who Needs To Measure This: Sales / Rev Ops, Tech, Maintenance
Why This KPI Is So Important: Service-to-Cash Rate is the average amount of time it takes customers to pay their invoices after you complete service calls for them. You want to get paid as soon as possible as often as possible, so you have access to the funds you need to run your company when you need them.
Like with Revenue Leakage, a high Service-to-Cash Rate can point to your techs needing to have paperless invoice documentation and payment-taking directly at a job site. It can also mean you need better procedures in your billing department to follow up with customers who take a long time to pay their invoices. Investing in field service billing software may help with this.
34. Expired Warranty Conversion Rate

How to Calculate: Divide the number of maintenance contracts you have on equipment that’s no longer under warranty by the total pieces of equipment you’ve serviced that have expired warranties. Then multiply that number by 100.
Who Needs To Measure This: Sales / Rev Ops, Tech, Maintenance
Why This KPI Is So Important: Expired Warranty Conversion Rate measures the percentage of customers who purchase maintenance service agreements for a piece of equipment after its warranty period expires. Similar to Contract Attachment Rate, this metric measures how often customers rely on you to keep their equipment running after it’s no longer under warranty (as opposed to getting a competitor to do maintenance or else just taking their chances).
A high number can mean your marketing efforts are effective (including upsells and cross-sells by your techs), you’re giving quality customer service, or both.

Customer satisfaction field service management KPIs
These KPIs for field service technicians are about how your customers see the work you do, both on-site and off. They’re not just about how quickly and proficiently your techs can complete service calls. They’re also about how well you treat and assist your customers, convincing them to stay with you – or even refer friends – rather than hire a competitor or do their own work for further service.
35. Customer Satisfaction Score (CSAT)

How to Calculate: Set up a feedback mechanism asking customers to rate the overall quality of service they receive (and maybe also rate the service they receive in different categories), usually on a scale of 1 (worst) to 5 (best). Then divide the total rating score (or scores, if measuring satisfaction in different areas) by the number of ratings (in a particular area). You can also take qualitative comments into account.
Who Needs To Measure This: Sales / Rev Ops, Tech, Maintenance
Why This KPI Is So Important: CSAT is an average measure of how satisfied your customers are with the service you give them. It can be an overall rating, ratings related to different elements of their experience (timeliness, quality of work, cost, etc.), or both.
Happier customers are more likely to give you repeat business, as well as to recommend your company to others. Ratings broken down by different service elements can give you deeper insight into what customers are satisfied or dissatisfied with about your company, such as work quality, efficiency, cost, customer service, and so on.
36. Customer Retention Rate

How to Calculate: Subtract the number of new customers you gained over a time period from the number of active customers you have at the end of that time period. Then divide that by the number of customers you had at the beginning of the time period. Finally, multiply that by 100.
Who Needs To Measure This: Sales / Rev Ops, Tech, Maintenance, Dispatcher/Scheduler
Why This KPI Is So Important: Customer Retention Rate measures the percentage of your customer base that requests repeat service from you, instead of going to a competitor or otherwise not giving you any more business. Customers are likely to stick with you if you give them quality service at a fair price.
If this metric is low, look into why. For example, is your customer service poor? Are your field service staff not providing sufficient quality service? Or is it merely that most of your customers come to you for one-off jobs?
37. Service Booking Rate

How to Calculate: Divide the number of service calls you book in a given time period by the total number of service requests you get during that same time period.
Who Needs To Measure This: Sales / Rev Ops
Why This KPI Is So Important: Service Booking Rate measures the percentage of times a customer who contacts you with a service request actually books a service appointment, as opposed to continuing to shop around.
How often customers – especially new customers – book services with you heavily depends on the quality of your marketing and customer service. You need to treat customers right, really sell them on why your company is the right choice, and give them enough accurate information for them to make an informed decision.
38. Churn Rate

How to Calculate: Divide the number of customers who become inactive or book service with a competitor over a period of time by the number of customers you had at the beginning of that time period. Then multiply the number by 100.
Who Needs To Measure This: Sales / Rev Ops
Why This KPI Is So Important: Churn Rate measures how often your customers become inactive or choose an alternative. A high rate can point to customers regularly being dissatisfied with the service you give. Investigate where the source of the dissatisfaction lies: is it poor customer service? Poor service quality? Too expensive pricing / too low value for money? Or is it a combination of factors?
39. Customer Effort Score

How to Calculate: Set up a feedback mechanism asking customers to rate the ease of use of your products and services, usually on a scale of 1 (very easy) to 7 (very difficult). Then divide the sum of those responses by the total number of responses.
Who Needs To Measure This: Tech, Maintenance, Sales / Rev Ops
Why This KPI Is So Important: Customer Effort Score is an average measure of how easily your customers can use your products and services. This includes how easy it is for them to find information on your products/services, get a question answered, get a request fulfilled, or get a problem solved.
A high Customer Effort Score indicates frustrated customers who are likely to become inactive or even go to a competitor. It should prompt you to look at how you design your products and services, and see if you can make them more user-friendly. You may also want to devote more resources to your customer service team so they’re able to offer your customers more timely and helpful support.
40. Net Promoter Score

How to Calculate: Set up a feedback mechanism where customers can rate how likely they are to recommend you to someone they know – usually on a scale of 1 (not likely) to 10 (very likely). Then, decide which scores will represent “promoters” (usually 9 and 10) and which represent “detractors” (usually 6 or below).
From there, divide the number of responses with “promoter” scores by the total number of responses, then multiply that number by 100. Then divide the number of responses with “detractor” scores by the total number of responses, and multiply the result by 100. Finally, subtract the “detractors” percentage from the “promoters” percentage.
Who Needs To Measure This: Sales / Rev Ops, Tech, Maintenance, Scheduler/Dispatcher
Why This KPI Is So Important: Net Promoter Score is the average likelihood that an existing customer would recommend your products and services to a new customer. A high Net Promoter Score means your service and customer support quality is good enough that you may be able to win business organically, through word of mouth. In that case, you may want to reduce your marketing spending, or at least adjust your marketing to target the groups that aren’t likely to recommend you (based on why they wouldn’t recommend you).
Explore our reporting product
Turn every field into a report, giving you insights that help you boost growth and profits.
How to set up KPIs from your field service reporting
Your field service reports are the best way to measure what happens directly at work sites. Ideally, you want to have a field service management software system that includes a mobile app. The app should both allow your techs to input information directly at the job site, and sync to your software at headquarters so your back office staff can immediately access that information.
It’s also useful if your FSM (field service management) platform ties your reporting functions into other areas of your operations. For example, being able to feed data from incoming reports directly into your analytics setup lets you measure your metrics & KPIs in real time.
Here’s a breakdown of the kinds of information that should be in a field service report:

Deep Dive
Review our guide to field service reporting for a more detailed explanation of the essential components of a field service report, as well as best practices and tips for what optimal field service reporting looks like, and how to automate your field reporting process.
How to leverage field service management dashboards for efficient KPI analysis
Another element of FSM software that makes field service management KPI analysis easier is dashboards. These screens provide summaries of practically any part of your operations, allowing you to view and act on information quickly. You can build custom reports using them, or even program actions to trigger automatically when metrics reach certain points.
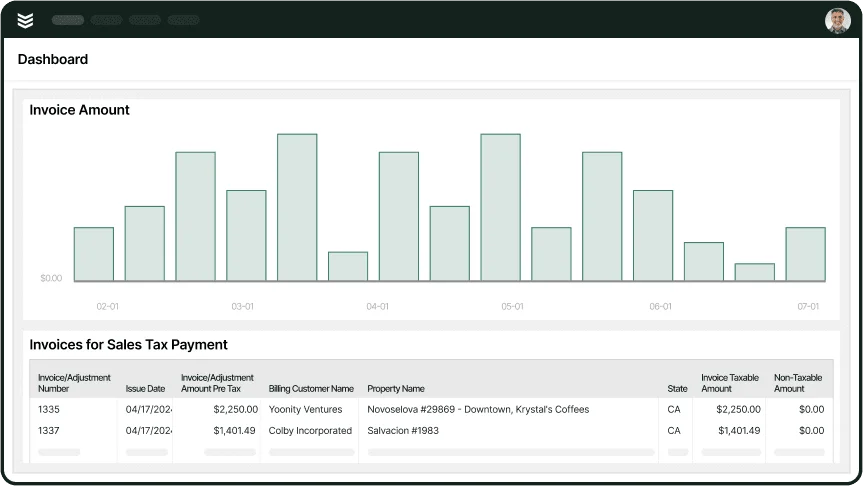
Take a dashboard like this for example:

You can use it to check when customers were billed, and whether or not they’ve paid yet, so you can follow up on late invoices. You can also verify customers were billed for the correct amounts, as well as track over time how much revenue different kinds of jobs are bringing in.
Expert Tip
See our article on field service dashboards for more ideas on how to use dashboards to streamline your field service operations.
How BuildOps helps track field service KPIs
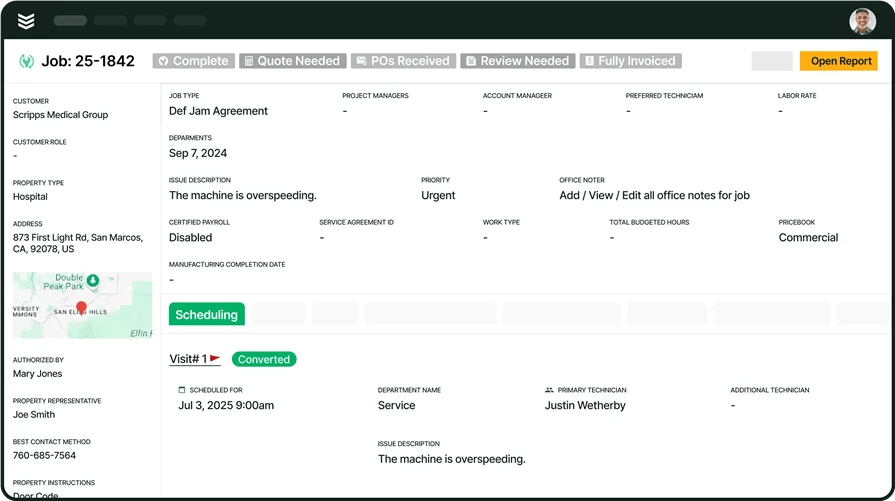
Image Source: BuildOps
BuildOps is software designed specifically for managing commercial field service ventures, from small individual jobs to large projects. It contains features like a scheduling and dispatch board that updates in real time, as well as complete customer notes – service call history, agreements, photos, equipment listed by property, and additional information – synced between your techs out in the field and your staff back at headquarters.
BuildOps also makes it easy to quickly fill in KPIs for reports with AI-powered features like speech-to-text, spelling/grammar check, translation, and automated invoice writing.
With BuildOps, choose the KPIs that matter
Customize your reporting based on ANY fields in our tool that are important to you.