


If your crews bounce between jobsites, service calls, and last-minute change orders, you need construction software that keeps estimators, PMs, foremen, and techs on the same page. The strongest construction management software ties takeoff, schedules, WIP, and job costing to service work—dispatch, work orders, asset history, and invoices—so nothing slips.
Many teams lean on field service management to handle the service side while projects roll, which is a must for contractors who run both. In this guide, we break down what separates the best construction management software and how to evaluate it like a pro who lives by margins, not buzzwords.
Here’s what we’ll cover:
- How to choose the right construction software for your team
- Top construction software features to look for & evaluate
- 10 best construction software & tools for your business
- 7 benefits of using construction management software
- 4 important construction software FAQs answered
First up, we’ll lock in the selection criteria—company size, project mix, service load, and accounting stack—so demos focus on real workflows, and pricing compares apples to apples.
How to choose the right construction software for your team
You run tight jobs and carry real risk. Treat demos like a field test, not a show. Use these questions to pressure-test construction management software against the way your teams bid, build, and service.
- Cost and commitment - What does three-year total cost of ownership include across seats, modules, storage, support, and implementation? Are monthly or annual terms available? Are price escalations and overage fees spelled out?
- Complexity and rollout - How steep is the curve for office and field? Who handles data conversion, template builds, and permission setup? How many training hours will crews need before go-live?
- Project and service workflows - Does it support lump-sum, T&M, AIA billing, retainage, and change orders without workarounds? Can estimates convert to schedules, subcontracts, POs, and work orders without retyping? Do service tickets tie to project assets and warranty data?
- Accounting and data flow - Will it sync cleanly with your accounting system with cost codes intact? Do time, materials, POs, and invoices post by phase to feed WIP accurately? Can committed costs and actuals reconcile in real time?
- Scale and control - Can it handle added divisions, entities, and subcontractors without performance loss? Are permissions granular by role, job, and cost code? Do you get full audit trails on every change?
- Features - Does the mobile app capture field forms offline such as dailies, safety, RFIs, punch lists, photos, and signatures? Can crews record time, materials, and approvals on site? Can admins build custom checklists and push them quickly?
Dialing in these answers separates contenders from the best construction management software for seasoned teams. Next up, we’ll break down the feature sets that carry real weight in daily operations and during closeout.

Top construction software features to look for & evaluate
Picking features can get messy because construction software covers estimating, project delivery, and service work in different ways. Some platforms focus on a few high-impact workflows while others span the full stack of construction management software. To keep this simple, we’ll group features into three buckets. First up is the engine that runs day-to-day operations in the field and in the office.
Field service management & project management construction software features

Field service management handles dispatch, work orders, crews on the move, and maintenance commitments. Project management keeps capital jobs on budget and on schedule, from takeoff to closeout. Together, this category should tighten scheduling, raise estimate accuracy, keep documentation clean, and give techs what they need on site.
The features to evaluate here help you deploy crews faster, control costs in real time, and keep field notes and approvals tied to the job. Focus on:
- Mobile connectivity - A reliable technician mobile app that works offline, syncs on return to signal, and supports photos, markups, signatures, RFIs, dailies, and punch from the jobsite
- Scheduling & dispatch - A live board with skill tags, crew assignments, travel ETAs, and route visibility using scheduling and construction dispatch software so crews land on tasks that fit certs, location, and availability
- Time tracking - Precise labor capture tied to phases and cost codes with time tracking, including foreman approvals in the field and audits in the office
- Field forms & quality controls - Custom templates with required fields for safety, inspections, T&M tickets, change approvals, and closeout packets, all available offline to keep documentation tight
- Fleet & equipment visibility - GPS, utilization, maintenance status, inspections, and alerting through fleet management to reduce idle time and prevent breakdowns during critical work
- Reporting & cost control - Operational dashboards via reporting that show labor burn, committed vs actual costs, cycle times, SLA performance, and WIP inputs so PMs can course-correct fast
CRM & sales construction software features

Sales and account management in construction software cover bid pipelines, renewals, and customer relationships across owners, GCs, and facility groups. This layer should tie cleanly to construction management software so a lead becomes a priced proposal, then a project or service ticket without retyping. A dedicated construction CRM keeps contacts, properties, and job history searchable for fast follow-up and accurate forecasting.
Focus on features that help teams win work, protect margins, and maintain long-term accounts:
- Customer hierarchies - Track owners with multiple properties, GC divisions, and decision chains so your team targets the correct contact at the correct location
- Service and project history - Centralize work orders, PM schedules, warranties, and past project data to spot renewal timing and upsell opportunities tied to assets and sites, with service agreements supporting planned maintenance programs
- Quoting & proposal workflow - Build scopes, alternates, and T&M packages with construction quoting software, then convert accepted proposals directly to projects or work orders without duplicate entry
- Invoicing & payments - Move awarded work into billing with invoicing and secure payments, including deposits, progress draws, retainage, and change-order approvals for clean AR
- Feedback and follow-up - Log calls, meetings, and site walks; set reminders; capture NPS and review data to keep key accounts warm and responsive
- Targeted communication - Segment by vertical, asset mix, geography, or contract status so reps send timely updates and renewal notices that match each account’s profile

Construction design & architecture features
Design and preconstruction tools keep builders aligned with architects and engineers. This category covers 2D sheets and 3D models, version control, constructability checks, and fast issue handoffs. Strong construction software here helps veterans validate scope, quantify materials, and expose risks before mobilization.
- Drawing and model management - Central control for PDFs, DWG, RVT, and IFC with version compare, sheet linking, and revision history tied to each job
- Model-based quantity takeoff - Object-level counts and measurements with assemblies and cost codes that export cleanly to estimating
- Clash detection and coordination - Issue tracking for structural, MEP, and architectural conflicts with status, assignee, and due dates visible to subs and PMs
- RFI and submittal linkage - Create design questions and product approvals straight from a sheet or model view so the thread stays with the detail
- Sequencing and simulation - 4D/5D views for phasing, access planning, and temporary works that show schedule and cost impacts before buyout
- As-built capture and field markups - On-site annotations, photos, and redlines that roll into the record set for closeout and warranty
Platforms vary in depth across these capabilities. What matters is tight connection to your construction management software so estimates, schedules, and field directives stay aligned from takeoff through closeout.
10 best construction software & tools for your business
You know the stakes—tight schedules, tighter margins, and crews spread across jobsites. This list highlights construction software used by seasoned contractors to run projects and service without rework. We grouped picks by where they excel so you can match tools to your workflow. The goal is simple: surface the best construction management software options for operations that live in bids, RFIs, change orders, and field work.
Best field service management & project management construction software
Field service and project management cover the daily engine of delivery: dispatch, schedules, estimates, RFIs, job costing, and closeout. Software in this category should keep foremen and PMs working off one plan, while techs submit clean field data that flows straight to budgets and billing.
1. Best for commercial construction operations: BuildOps

BuildOps unifies project and service operations so coordinators, PMs, and field techs share live data. It ties scheduling, dispatch, estimating, work orders, change management, and cost tracking into one workflow, which keeps WIP accurate and closeout clean. Teams get fast office-to-field handoffs and fewer gaps between estimating, operations, and billing.
Industry Specialization: Commercial
How Pricing Works: Per user, annual contract
What Sets It Apart: Field service strength connected directly to project controls and real-time financials
Key Features:
- Live board for crew assignments with skills, locations, and availability
- Mobile app for offline forms, RFIs, photos, signatures, and time capture
- Quote to cash with progress billing, retainage, and robust reporting
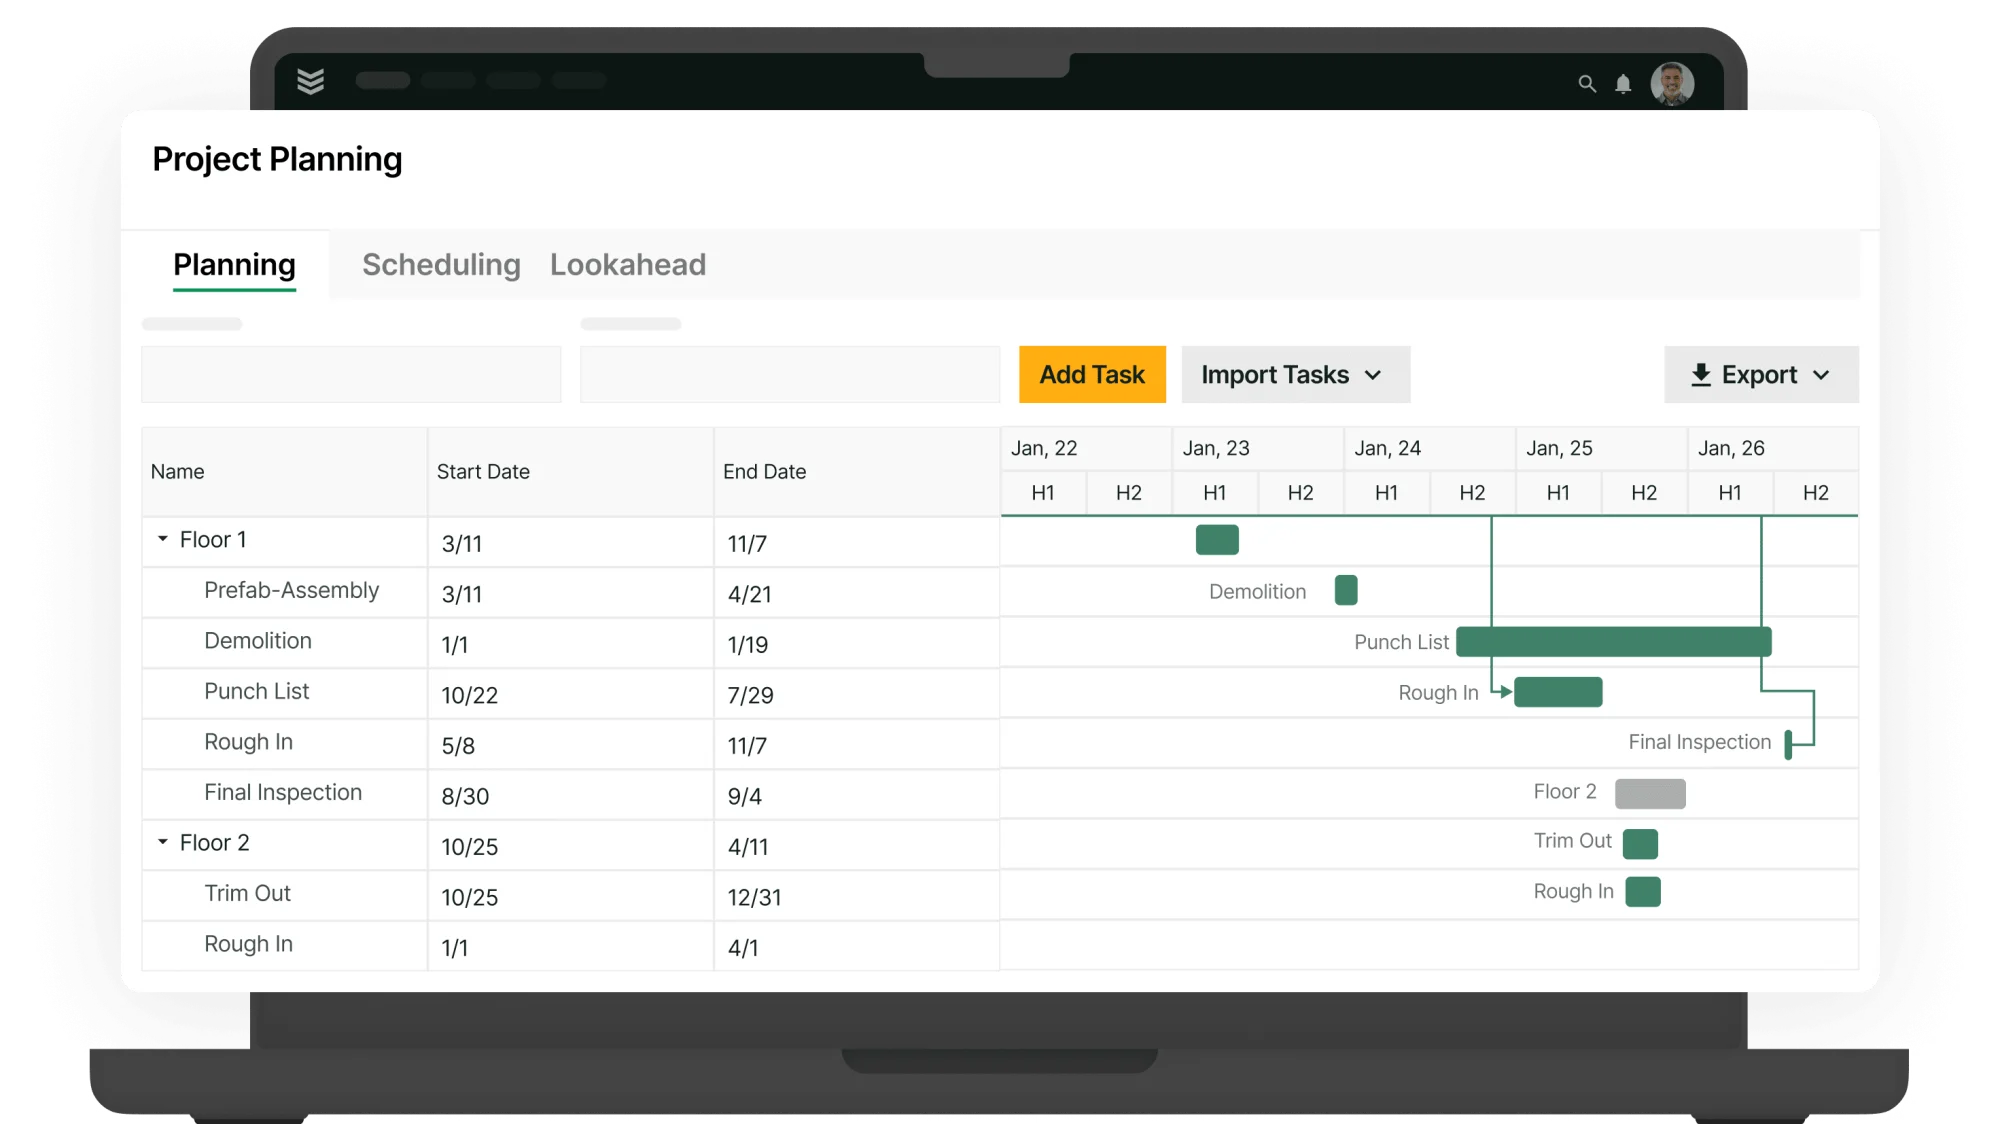
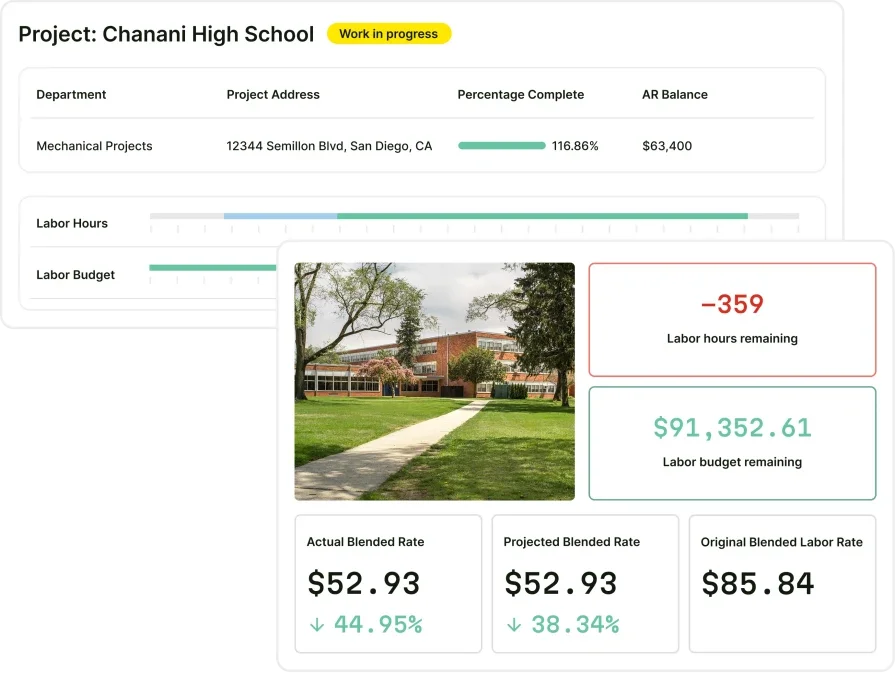
See how BuildOps runs projects and services
Scheduling, dispatch, field app, job costing, and billing for commercial construction.
2. Best for residential and service-focused trades: ServiceTitan

Image Source: ServiceTitan
ServiceTitan emphasizes high-volume service work. Call booking, dispatch, and strong on-site sales tools help techs move from appointment to approval quickly, which suits replacement and maintenance programs. Construction firms that require detailed project controls, AIA progress billing, or complex cost coding may need additional systems to cover those needs.
Industry Specialization: Residential and specialty service
How Pricing Works: Contact vendor for a tailored plan
What Sets It Apart: Mature service workflows and polished technician experience
Key Features:
- Call intake, dispatch, and route visibility for rapid response
- Technician app with price presentation and on-site approvals
- Membership and recurring service program management
Compare ServiceTitan to BuildOps here to see which one is the better fit for your construction team.
3. Best for GC project management at scale: Procore

Image Source: Procore
Procore focuses on large project delivery with structured document control and financial workflows. Drawings, RFIs, submittals, coordination items, budgets, and change events live in one platform so GCs and subs stay aligned on scope and cost. Teams that also run a service division or require technician-style dispatch and asset history typically pair Procore with a dedicated FSM solution.
Industry Specialization: General contractors and large commercial projects
How Pricing Works: Tiered licensing, typically annual
What Sets It Apart: Deep project management with rigorous document and cost controls
Key Features:
- RFI, submittal, and change management tied to budgets and cost codes
- Drawing and model management with revision tracking and field markups
- Portfolio reporting for commitments, actuals, and progress billing
4. Best for small home service crews: Jobber

Image Source: Jobber
Jobber fits contractors handling quick residential visits and small-ticket projects. It automates booking, reminders, and follow-ups while tying schedules, timesheets, customer records, invoices, and payments together—handy for handyman work, punch lists, and light maintenance. Shops that need AIA billing, deep job costing, complex cost codes, or multi-entity accounting may outgrow it.
Industry Specialization: Residential
How Pricing Works: Monthly subscription by user count and feature tier
What Sets It Apart: Strong focus on home services with simple scheduling and customer communication
Key Features:
- Online booking with automated confirmations and reminders
- Intuitive job forms and checklists for consistent site visits
- Drag-and-drop scheduling with basic route optimization
Best CRM & sales construction software
CRM and sales in construction software handle bid pipelines, renewals, customer hierarchies, and site portfolios. This layer should connect cleanly to your construction management software so a lead turns into a priced proposal, then a project or service ticket without retyping. The picks below help seasoned teams keep relationships tight while protecting margin.
5. Best for sales management: Buildertrend

Image Source: Buildertrend
Buildertrend offers customer and sales management for builders and remodelers, with proposal tools, automated follow-ups, and homeowner communication that keeps clients in the loop. Email marketing and targeted outreach support steady pipeline activity. Large commercial firms needing AIA billing, complex cost coding, and service contract depth may hit limitations.
Industry Specialization: Home builders and remodelers
How Pricing Works: Monthly subscription model (starting at $499/mo)
What Sets It Apart: Lead funnels with email marketing and targeted proposals
Key Features:
- Daily logs and client updates that document progress and decisions
- Central hub for creating, tracking, and nurturing leads through proposals
- Contract proposals with e-signatures and clear approval trails
6. Best for inventory-aware service sales: ServiceTrade

Image Source: ServiceTrade
ServiceTrade supports commercial contractors with office coordination, sales tracking, and inventory awareness so estimators and account reps know parts availability before promising timelines. Job history and asset data help teams forecast upcoming needs and build accurate quotes. Companies requiring heavy project controls or AIA workflows typically pair it with separate project systems.
Industry Specialization: Field service management
How Pricing Works: Subscription pricing based on seat count
What Sets It Apart: Inventory visibility tied to sales activity so quotes reflect real stock and lead times
Key Features:
- Parts forecasting to prevent stockouts during quoted work
- Precise job tracking with timecards that refine future estimates
- Customer updates and documentation that keep stakeholders aligned
7. CRM suited to residential contractors: Housecall Pro

Image Source: Housecall Pro
Housecall Pro delivers CRM and sales workflows for residential contractors and home service teams, covering pipeline management, proposal creation, invoice tracking, and basic accounting ties. It fits outfits that value simple communication and quick approvals. Commercial contractors needing strict cost structures, AIA billing, or enterprise reporting may require a different toolset.
Industry Specialization: Residential contractors
How Pricing Works: Monthly subscription based on seats
What Sets It Apart: Pipeline tools and proposal workflows tailored to residential service
Key Features:
- Pipeline management with tasks and reminders from lead to invoice
- Proposal options that help close work and lift ticket values
- Customer communication tools for timely updates and renewals
Review our side-by-side comparison of Housecall Pro & BuildOps to see which one’s features meet your crew’s needs better.
Best construction design & architecture software
Tools in this group support drawings, models, takeoff, coordination, and handoff to project teams. The aim is simple: validate scope, quantify early, and surface clashes before mobilization.
8. Best for BIM production support: TrueCADD

Image Source: TrueCADD
TrueCADD provides BIM modeling and CAD production for contractors that need shop drawings, coordination models, and quantity takeoff without adding headcount. The team works across Revit, AutoCAD, and open formats, which helps subs and GCs keep models current through buyout and installation. It may not fit teams that want an in-house modeling platform with native project controls.
Industry Specialization: BIM and drafting services for builders and subs
How Pricing Works: Engagement-based pricing per scope
What Sets It Apart: Flexible production capacity across major design file types
Key Features:
- Revit and CAD modeling for coordination, fabrication, and as-builts
- Quantity takeoff and sheet setup aligned to contractor cost codes
- Clash detection reports with issue logs for field crews and PMs
9. Best for model-linked project documents: Autodesk Build

Image Source: Autodesk Build
Autodesk Build centralizes drawings, RFIs, submittals, issues, and cost events while connecting to models in the Autodesk ecosystem. Field teams mark up sheets, track changes, and push issues to assignees with status and due dates. Strong fit for GCs and trades already invested in ACC. Teams that need heavy service ticketing or technician dispatch typically add a separate FSM system.
Industry Specialization: General contractors and commercial trades
How Pricing Works: Tiered annual licensing
What Sets It Apart: Tight link between controlled documents and model views
Key Features:
- Sheet and model management with version compare and markups
- RFI, submittal, and change workflows tied to budgets and cost codes
- Issue tracking with assignments and due dates for coordination
10. Best for quick plans and diagrams: SmartDraw

Image Source: SmartDraw
SmartDraw helps precon and field teams draft site logistics plans, safety layouts, org charts, and simple floor plans fast. Templates and symbol libraries speed up planning meetings and method statements. It may not suit firms that require BIM-grade modeling or deep integration with cost and schedule.
Industry Specialization: Preconstruction planning and field logistics
How Pricing Works: Per-user subscription
What Sets It Apart: Fast diagramming with contractor-friendly templates
Key Features:
- Site logistics, crane picks, and laydown plans with drag-and-drop symbols
- Floor plan and space diagrams with quick exports for submittals
- Workflow charts and checklists for method statements and safety plans

See where commercial contracting is headed
Get data on backlogs, margins, hiring, and tech adoption.
7 benefits of using construction management software
Veteran teams juggle buyout, RFIs, subs, and active jobsites. Centralized construction software gives every role one source of truth from takeoff to final billing. When construction management software links field and office, decisions speed up and waste drops. The best construction management software delivers gains like these.
1. Higher field productivity
Foremen, PMs, and techs work from synced schedules, budgets, and approved changes. No double entry. No hunting for files. Crews spend extra hours building while the system handles handoffs, approvals, and history.
2. Faster scheduling and deployment

Coordinators see availability, skills, locations, and travel in one calendar, which cuts windshield time and idle gaps. Teams that standardize capacity planning with construction contractor scheduling software assign crews with higher confidence and fewer resets.
3. Stronger field documentation
Digital dailies, photos, signatures, and T&M tickets sync from jobsite to job cost without delays. Disputes fade because timestamps and approvals live with each work item. Many firms lock consistency by defining templates in construction field report software.
4. Tighter project controls and client coordination

Live budgets, committed costs, forecast-to-complete, and clean RFI threads keep scope, cost, and schedule aligned. Portfolio methods outlined in commercial construction project management help PMs maintain that alignment across simultaneous jobs.
5. Quicker billing and cleaner cash flow

Progress draws, retainage, T&M, and change approvals flow straight from field data into AR. Cash lands sooner, write-offs shrink, and collections need fewer touches. Many teams anchor these workflows with construction invoice software tied to job costs.
6. Reliable mobile access for crews
A field app that works offline keeps tasks, checklists, RFIs, and timecards moving when signal drops. Foremen submit complete packets from the slab, and the office posts costs the same day. The capabilities summarized in the construction app roundup reflect what seasoned crews expect on active jobsites.
7. Company-wide visibility for smarter decisions
Dashboards pull actuals, commitments, pipeline, and AR into one view. Leaders spot margin erosion early, then adjust staffing, buyout, or sequence before profit slips. Invoice and cash metrics sit next to cost performance so actions match reality.

4 important construction software FAQs answered
You already run tight jobs. These answers target field service pros who estimate on site, juggle RFIs, and need clean handoffs to accounting. The focus stays on construction software that supports hard deadlines and real crews.
1. What is construction software?
Construction software unifies estimating, scheduling, dispatch, cost control, RFIs, work orders, and billing so field and office share one dataset. Some tools focus on dispatch or design; others run end to end with mobile capture and accounting sync. Choose a stack that mirrors how your crews actually work.
2. How does construction management software work?
Veteran teams map daily operations to structured digital workflows. Estimates convert to budgets, POs, and work orders; field time, photos, and T&M post to cost codes; WIP and forecasts update in real time. Offline apps sync when signal returns, and approvals create a permanent audit trail.
3. Is construction software worth the price?
If the platform cuts cycle time from quote to invoice and flags overruns early, the answer is yes. Wins show up in tighter labor capture, fewer change-order disputes, faster collections, and cleaner WIP. The best construction management software also reduces admin touches per job, which lifts margin.

4. What best practices keep a rollout on track for field estimators and service crews?
Treat implementation like a short project with clear scopes and owners. Start with the flows that move cash, then expand. Keep training tied to live jobs so crews practice with real data and habits stick.
- Define two pilots: estimate-to-project and call-to-invoice
- Standardize cost codes, phases, and item catalogs before import
- Build mobile forms for dailies, RFIs, T&M, and change approvals
- Require foreman approval on time and materials the same day
- Map estimate handoff to POs, subcontracts, and budgets
- Lock dispatch rules around skills, certs, zones, and travel limits
- Integrate accounting early; reconcile WIP and AR weekly
- Train supervisors first; have them coach their crews on site
- Track KPIs: labor variance, DSO, rework rate, schedule slippage
- Freeze add-ons until after go-live; phase in noncritical modules
You live in the details—estimates, WIP, RFIs, closeout. The construction software you choose should match that reality. Start with the workflows that move cash and risk, then judge vendors by how cleanly they connect field data to budgets and billing. Prioritize strong mobile, clear dispatch, and real-time job costing. The best construction management software turns dailies, photos, time, and approvals into decisions your PMs can act on without delay.
Our guide covered what to evaluate, feature categories that matter, tools worth a look, and the gains veteran teams see once office and field share one system. If your operation runs both projects and service, an all-in-one platform can reduce handoffs and duplicate entry. BuildOps ties scheduling, dispatch, project tracking, job costing, and invoicing together so commercial teams stay aligned from bid to warranty.
Curious how this would look with your data? You can schedule a free demo and walk through a live ticket or sample project with our team—no pressure. Bring a scenario, we will run it end-to-end so you can judge fit for your crews and clients.
See how BuildOps keeps construction projects on time, and in sync
Scheduling, dispatch, field reporting, job costing, and billing—all in one system