Executive Summary: Analytics & Reporting Trends in the Construction Industry
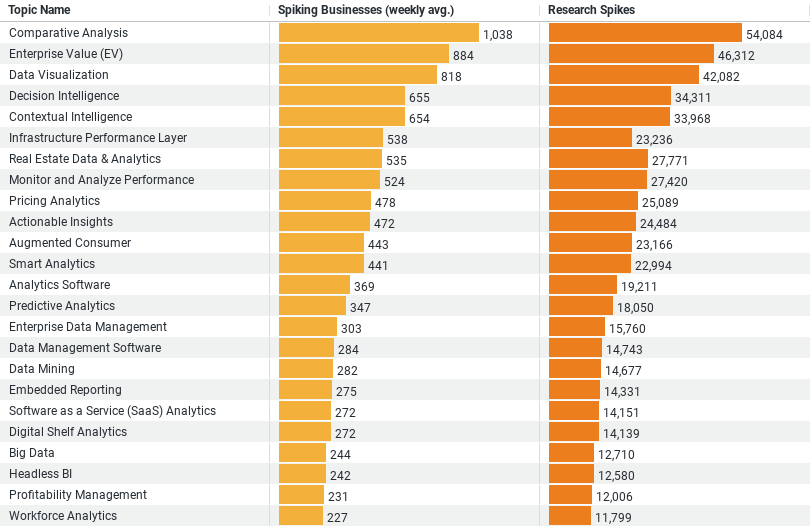
– Comparative Analysis leads with a weekly average of 1,037.62 spiking businesses and a total of 54,084 research spikes, indicating a strong interest in comparing data sets, possibly for benchmarking or performance evaluations.
– Enterprise Value (EV) follows with 883.69 spiking businesses on a weekly average and 46,312 research spikes, highlighting the industry’s interest in assessing companies’ total value, perhaps for investment or acquisition purposes.
– Data Visualization is third, with 818.13 spiking businesses and 42,082 research spikes, reflecting the importance of visual data interpretation for insights and decision-making.
– Decision Intelligence shows significant interest with 655.35 spiking businesses and 34,311 research spikes, pointing towards the adoption of advanced analytics for strategic decisions.
– Contextual Intelligence closely trails with 653.63 spiking businesses and 33,968 research spikes, emphasizing the value of contextualized data analysis for more informed and relevant insights.
This summary underscores the construction industry’s focus on leveraging data analytics and reporting for various strategic purposes, including comparative analysis, enterprise valuation, data visualization, and intelligence-driven decision-making.
Comparative Analysis: The Benchmark for Success
Leading the pack with a weekly average of 1,037.62 spiking businesses and a total of 54,084 research spikes, Comparative Analysis stands out as the industry’s top interest. This trend underscores the construction sector’s keenness on benchmarking and performance evaluations. By comparing datasets, companies are not just assessing their performance against competitors but are also identifying areas for improvement and growth. This proactive approach to benchmarking facilitates strategic planning and fosters a competitive edge in a market that’s as dynamic as it is challenging.
The Valuation Vanguard: Enterprise Value (EV)
Enterprise Value (EV) follows closely, with 883.69 spiking businesses weekly and 46,312 research spikes, highlighting the industry’s focus on understanding the total value of companies. This interest goes beyond mere financial assessment; it’s about recognizing potential investment opportunities, merger and acquisition targets, and the overall health of businesses within the construction sector. By placing a premium on EV, the industry is gearing up for strategic growth, ensuring that every investment or acquisition is a step towards future-proofing their operations.
Visualizing Success: The Power of Data Visualization
Data Visualization claims the third spot, with 818.13 spiking businesses and 42,082 research spikes. In a field as multifaceted as construction, the ability to visually interpret complex data sets is invaluable. From project timelines and budget allocations to risk assessments and resource management, data visualization tools are enabling companies to glean insights at a glance. This not only enhances decision-making but also improves communication across teams and with stakeholders, ensuring that everyone is on the same page.
Decision Intelligence: Strategizing with Data
With 655.35 spiking businesses and 34,311 research spikes, Decision Intelligence marks a significant interest within the sector. This approach goes beyond traditional analytics, integrating data with machine learning and AI to forecast trends, predict outcomes, and make informed strategic decisions. For the construction industry, where projects are large-scale and risks are high, the ability to anticipate challenges and opportunities can be the difference between success and failure. Decision Intelligence equips businesses with the foresight and agility needed in today’s fast-paced market.
Contextual Intelligence: Understanding the Bigger Picture
Closely following is Contextual Intelligence, with 653.63 spiking businesses and 33,968 research spikes. This interest points towards the industry’s move towards more nuanced and context-aware analysis. In construction, where every project is unique and influenced by a myriad of factors, understanding the context is key. Whether it’s adapting to environmental considerations, regulatory changes, or market dynamics, Contextual Intelligence allows businesses to tailor their strategies to the specific nuances of each project.
Conclusion
The insights from the construction industry’s research into Analytics & Reporting paint a picture of a sector that is keenly aware of the power of data. By prioritizing areas such as Comparative Analysis, Enterprise Value, Data Visualization, Decision Intelligence, and Contextual Intelligence, the industry is not just adapting to the digital age; it’s leading the charge towards a more informed, strategic, and resilient future.
As construction companies continue to navigate the complexities of modern projects and market demands, their investment in analytics and reporting is a testament to the industry’s commitment to excellence. By leveraging data to inform every decision, the construction industry is not just building structures; it’s building a legacy of innovation and success that will stand the test of time.
Company Sample Data for Researching the Topic of Analytics & Reporting

This data, specifically focusing on the construction industry’s engagement with Analytics & Reporting, offers insights into how businesses ranging from micro to large are prioritizing data-driven strategies. Let’s delve into the details of this dataset and explore why these trends might be observed across various company sizes.
Overview of the Data
The dataset categorizes companies based on their size, ranging from “Micro (1 – 9 Employees)” to “Large (1000+ Employees),” and provides the following metrics for each category:
– Spiking Businesses (weekly avg.): The average number of businesses within each size category showing a marked increase in research activity related to Analytics & Reporting on a weekly basis.
– Percent of Total: The proportion of businesses within each size category relative to the total number of businesses engaged in researching Analytics & Reporting.
Key Insights from the Dataset
1. Micro (1 – 9 Employees): These companies show a moderate level of interest, with a weekly average of 646.88 spiking businesses, accounting for approximately 9.47% of the total. This suggests that even the smallest companies recognize the value of data analytics, possibly for optimizing operations or enhancing competitive edge, despite their limited resources.
2. Small (10 – 49 Employees): Small businesses demonstrate a significant leap in interest, with 1,708.65 spiking businesses weekly, making up 25.00% of the total. This increased interest could be due to small companies seeking to leverage data analytics for growth, operational efficiencies, and to compete more effectively against larger counterparts.
3. Medium-Small (50 – 199 Employees): This category tops the chart with 1,935.50 spiking businesses and 28.32% of the total, indicating a strong focus on Analytics & Reporting. Businesses of this size may have more resources to invest in sophisticated analytics tools and could be looking to data-driven insights for scaling operations and refining strategies.
4. Medium (200 – 499 Employees) and Medium-Large (500 – 999 Employees): These categories show a decrease in the weekly average of spiking businesses to 1,033.83 and 556.96, respectively. This could reflect the challenges of coordinating more complex operations and the need for more tailored analytics solutions as companies grow.
The Possibilities of Why This Is A Trend
The observed trend suggests a bell curve of interest in Analytics & Reporting, with medium-small companies showing the highest engagement. Several factors could contribute to this pattern:
– Resource Allocation: Smaller companies, especially those in the micro to small range, may be more agile but have fewer resources to dedicate to comprehensive analytics initiatives. However, their engagement indicates a strategic focus on data-driven decision-making.
– Strategic Prioritization: Medium-small companies likely have the right mix of agility and resources, enabling them to invest significantly in analytics. This could be a strategic move to fuel growth and improve competitiveness.
– Complexity and Customization: As companies grow larger, the complexity of their operations increases, necessitating more customized analytics solutions. This could lead to a relative decrease in the number of spiking businesses, as larger initiatives may take longer to implement and might not be captured in a weekly average.