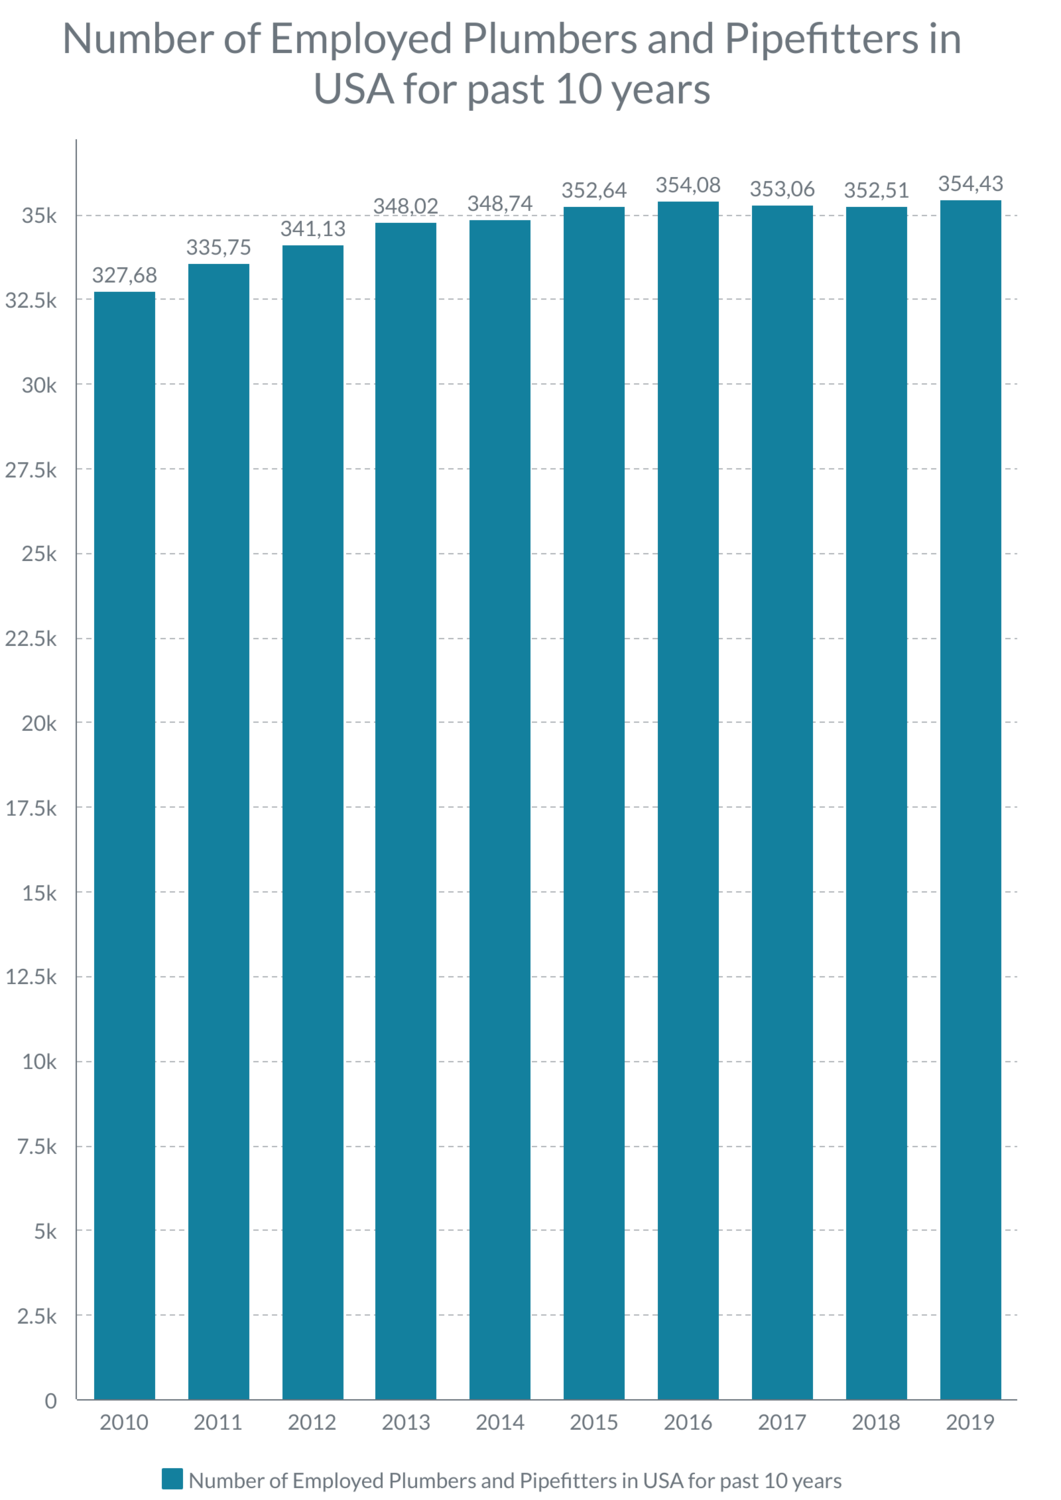

The source of this data is the U.S. Bureau of Labor Statistics.
The data from the past 10 years shows that employment of plumbers and pipefitters has grown steadily. From 2010 to 2019, the number of employed plumbers and pipefitters has increased from 327,680 to 354,430, an overall increase of 8%. This equates to an average annual increase of 0.8%. The most significant growth was seen between 2010 and 2011, when the number of employed plumbers and pipefitters rose by 8,070, or 2.5%. The smallest growth was seen between 2017 and 2018, when the number of employed plumbers and pipefitters increased by only 1,050, or 0.3%. The U.S. Bureau of Labor Statistics predicts that employment of plumbers and pipefitters will continue to grow by 7% by 2029, which would be an additional 24,706 jobs.