How & Why to Use a Field Service Ops Dashboard


Keeping on top of everything happening at your field service company can be a daunting task. Whether it’s writing field service reports or doing internal analytics, you have to digest a lot of information and use it to make informed decisions on how to steer your business. If you try to do this all manually, you’ll likely end up buried in paperwork.
A more efficient solution is to use field service dashboards. As a key component of broader field service management systems, you can set up these overviews of your company’s functions to be as general or as specific as you like. Then you can use them to manage your business with the information – and sometimes the controls – you need at your fingertips. In this article, we discuss how to get the most out of these dashboards, including:
- Benefits of using field service management dashboards
- 6 field service dashboard types & examples of each one
- Key features of a field service dashboard
- 5 things to consider when implementing a field service dashboard in your system
- Critical field service management dashboard FAQs answered
Let’s start with a more detailed explanation of some of the key advantages of using a field service dashboard over doing the same processes manually.
Benefits of using field service management dashboards

The main advantage of using field service dashboards is making information and functions related to your company more accessible. That way, you can draw conclusions and make decisions without having to sift through paperwork, or go through a complicated process or chain of command. Here are five examples of how that can benefit your business:
- Get a single view of company information: Dashboards can show a lot of different information in one place. This lets you find out at a glance if something in your company needs to be addressed.
- Cycle between general and detailed views: Dashboards allow you to drill down into specific areas of your company’s operations, so you can micro-manage those functions. Then you can zoom back out and see the effects on the rest of your company.
- Respond to issues faster: Dashboards give you access to quick commands while putting all the information you need to make informed decisions in front of you. That way, you can answer a customer’s question, schedule appointments, dispatch technicians, or assist with on-site problems much quicker.
- Advanced, in-depth analysis: Because dashboards are able to store and present large amounts of historical data, you can also often use field service analytics to quickly gain insights on how your company could be performing better.
- Automate processes: When necessary, you can automate field service business processes based on data you analyze from a dashboard. For example, you can have the dashboard fill an order for certain parts once your inventory gets below a certain amount.
These benefits can be applied to several different parts of your organization, as we’ll show with the example dashboards below.
6 field service dashboard types & examples of each one
You can use a field service management dashboard for each of several different functions of your business. Here are some suggestions for how to use them this way.
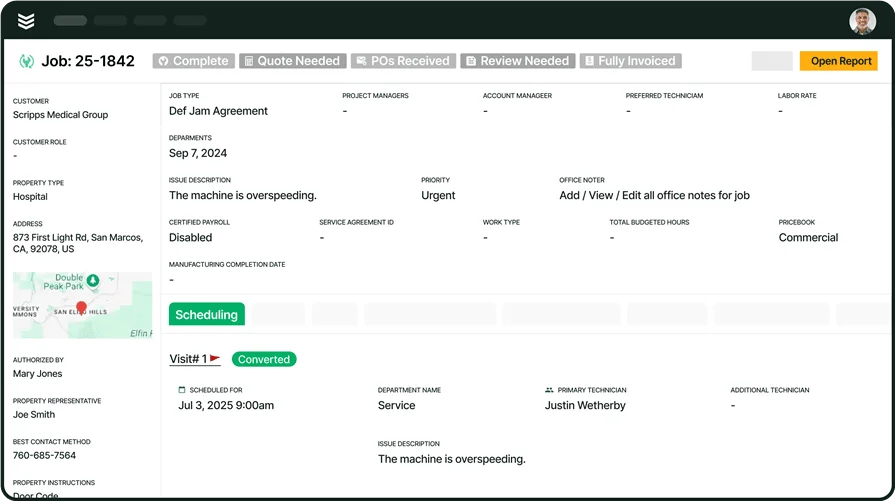
1. Invoicing & payments

What This Dashboard Measures: Statistics related to the amount invoices are for, and when they’ve been issued or paid
At a basic level, a field service invoice software dashboard should measure the amount each invoice is billed for. This lets you double-check that a client was billed correctly for the parts & labor involved, and lets compare invoice amounts to view price patterns and look for potential issues.
Another thing an invoice dashboard should do is track when invoices are issued and paid. This lets your company follow up with reminders to clients who haven’t paid their invoices yet.

2. Scheduling & dispatch
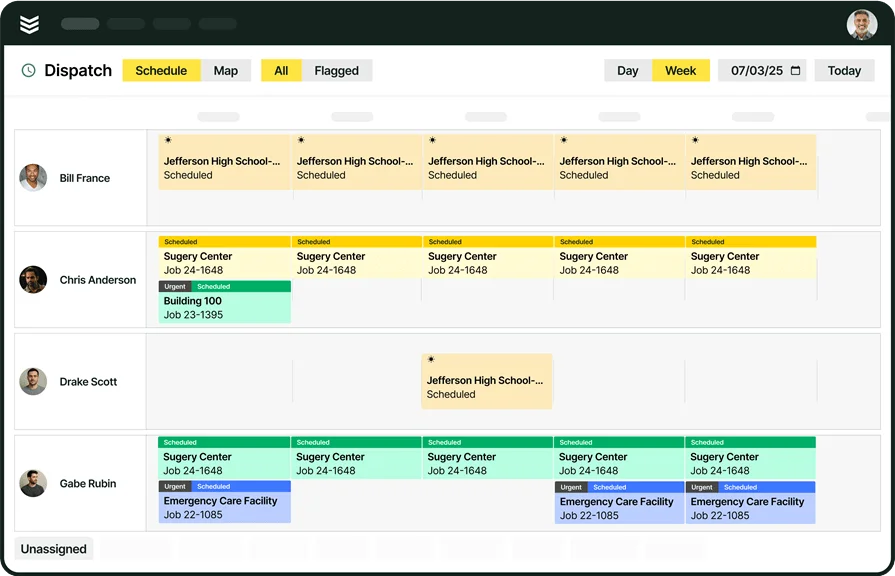
What This Dashboard Measures: When service appointments are booked, and which technicians are assigned to them
A field service scheduler dashboard shows the dates, times, and assigned techs of booked appointments. Ideally, it should also show which types of jobs techs are qualified to handle, and when they are available.
This helps dispatchers with field service scheduling to get the right techs to the right appointment at the right time.This allows schedulers/dispatchers to more efficiently distribute work between techs and help prevent any one from being overworked.
3. Resource & inventory management

What This Dashboard Measures: The number and condition of pieces of equipment your company owns
This type of dashboard allows you to perform field service asset management: keeping track of how many parts you have that you may need to install or replace on jobs. It also lets you track how many tools you have for performing specific jobs, and what condition those tools are in. Ideally, it should also have a function for quickly ordering new parts when stock gets low, or ordering repairs or replacement of tools that get too worn out.
4. Fleet management

What This Dashboard Measures: The number, condition, and usage rates of any vehicles designated for field technician use
If you use vehicles to transport techs and equipment, you should have a dashboard to keep an eye on those as well. The dashboard should track how much fuel each vehicle has left, and any potential maintenance work each one may need done soon.
Ideally, it should also track how often each vehicle is being used and how far it’s traveling. This can help with optimizing routes, both for distance (i.e. jobs in the same area) and for jobs requiring specifically-outfitted vehicles. In turn, this can save you expenses for vehicles, fuel, and maintenance.
5. Technician productivity
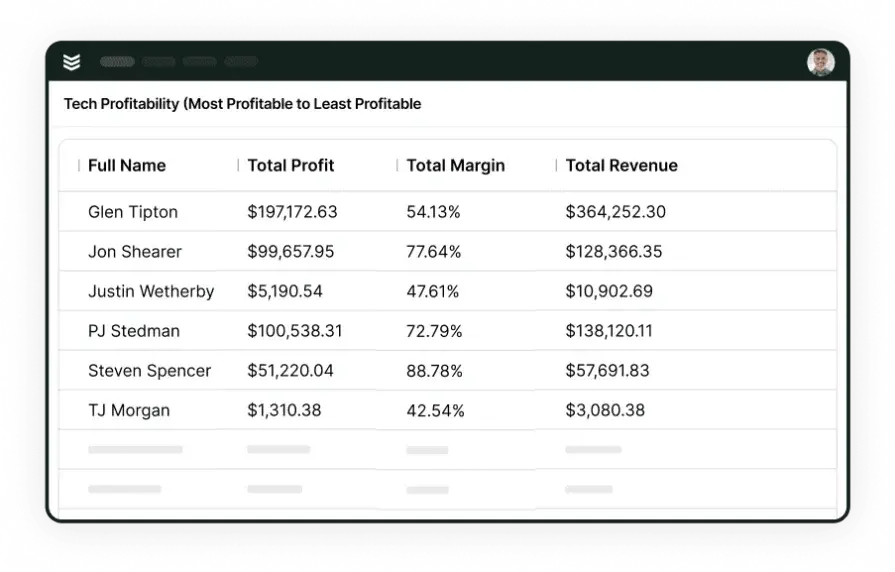
What This Dashboard Measures: How efficiently techs are working
This dashboard lets you look at metrics related to how each tech in your company is performing in the field. Such metrics include time to response, travel time, mean time to complete, first-time fix rate, number of jobs completed, and so on. The idea is to see how profitable each of your techs is: how quickly they can get from one job to the next, how thoroughly they complete their work, and how efficiently they’re using their work time.
6. Financial analytics

What This Dashboard Measures: Metrics related to revenue, costs, and profit opportunities
A dashboard like this lets you evaluate the overall profitability of your business. For example, you can compare how much service calls costs you to fulfill (parts, technician salary, vehicle fuel, etc.) against how much revenue they bring in. Lower than expected rates may point to billing errors or pricing errors, or not fully taking advantage of chances to upsell (such as additional repair work or maintenance contracts after warranties expire).
Key features of a field service dashboard
Dashboards can help you monitor and control many different aspects of your business, but how do you get the most out of them? Here are four things dashboards should be able to do to maximize efficiency.
1. Ability to base a report on any metric you want
The more metrics a dashboard is able to turn into reports, the more flexible (and useful) it is when it comes to analysis designed to streamline your company’s operations. Being able to create a report from any field on a dashboard – like you can with BuildOps field reporting software – lets you mix and match data to reveal patterns and uncover opportunities to grow your business.
2. Real-time reporting
Reporting is most useful for analytics when based on fresh, up-to-date data. Look for a dashboard that can create reports by automatically pulling data from parts of your operations that you are already monitoring anyway. This gives you reports you can take action on faster, without having to plug a bunch of numbers and formulas into a spreadsheet.
3. Most important metrics grouped together
Another useful feature when setting up a dashboard is to set a default group of metrics that you use most often. That way, you can always keep an eye on the most crucial stats for your business. BuildOps can help you create your “most used” list of KPIs when we onboard you.
4. Easy-to-build custom reports
It’s still helpful to be able to quickly throw metrics – even ones you don’t use often – together in a custom report. Find a dashboard that has a fast, easy-to-use interface that lets you pull stats from wherever you need them to create a custom report in minutes.
5 things to consider when implementing a field service dashboard in your system
Including dashboards in your field service management can provide many productivity and efficiency benefits. However, you’ll need to do some initial decision-making and setup before you start seeing the payoff. Here are 5 things to think about when implementing field service management software.
1. Use cases
Your first and foremost consideration should be why you want to use a particular dashboard. Which parts of your operations are you looking to monitor, and what is your specific goal in doing so? Thinking about this will help you ensure that you get the best return on your investment.
Looking at your dashboards this way also prevents you from wasting too much time tracking the things that aren’t critical. Ask yourself at a very basic level why you need information and why having that information will help with your operations. If it’s unclear, you might not need to focus on that data right now, and instead, start with the things that really matter to you.
2. Staff proficiency & training
Once you figure out which dashboards you are going to use, you need to decide who is going to need access to each of them. Then you need to train these staff members on how to use the interface for each dashboard they need.
You should figure out beforehand if your staff will need specific skills to use a dashboard you set up. For example, if you plan on using a dashboard for analyzing data to streamline your operations, you may need an employee with data analysis skills. If so, you need to either get one or more of your employees certified, or hire someone who already has the qualifications.
You also don’t want to get lost in giving all the information you have to every employee. It’s not about controlling access, but having teams focus on what’s most important to them. Do techs need to look at your invoicing-related dashboards? Maybe not, if it’s the admin side of invoicing that’s causing invoices to go out later and later. But if techs aren’t finalizing their project summaries and submitting field service reports promptly, then maybe they do need to be more involved with your invoicing dashboards.
3. Integration with existing systems
Unfortunately, dashboards won’t always fit seamlessly into your existing technology stack, so you’ll have to either find dashboards that will, or budget for the time and effort it will take to get them synced with your current systems.
An important related point to think about is specific functionality you may want from a dashboard. You may want to be able to report on certain metrics, or bundle particular sets of metrics into a custom report. For example, you may want fleet management functions and the ability to measure metrics such as the average amount of time your techs spend traveling in a work day, the average time it takes them to arrive at job sites, and how often they arrive on time. This can let you get the most efficient and balanced use out of your vehicles.
4. Data storage & security
One of the main advantages of dashboards is that they store information digitally, which makes the data easier to access than having to find particular filed paper documents. Many also use cloud technology to store data and run, which makes it even simpler for people on your team to access such dashboards anywhere and anytime they need to.
The trade-off is that data can become more vulnerable to being stolen from the outside or leaked from the inside. So it’s important to have the proper data security practices in place. This includes training staff on how to properly handle sensitive data so that it doesn’t end up in the wrong place. For example, you don’t want to be giving out customer contact information any more than you have to. And you also don’t want building passcodes leaked, potentially letting unauthorized people gain access to properties.
5. Testing & improving over time
You’ll rarely be able to just hit the ground running with a new dashboard. Instead, you’ll likely need to test it to make sure it’s doing what you want it to do, and has the important information you’re looking for. You may need to do this with multiple dashboards from different providers. This takes time, money, and other resources away from running your business’s other functions, so be sure to account for that.
Something else to think about is if your dashboards can scale with you. Is the dashboard flexible enough to take on potential new functions within your company? You may need to periodically test it down the road to see if it’s keeping up with what your company needs from it. For example, your contracting company may branch out into a new field – like if you’re in HVAC, you may start offering refrigeration equipment services, or the other way around. You need your dashboards (and overall field service management platform) to track the most important KPIs that are unique to both industries.
Critical field service management dashboard FAQs answered
Here are the answers to some frequently asked questions from contractors about setting up and using field service management dashboards.
1. What is a field service management dashboard?
A field service management dashboard is a software or app screen that summarizes a field service company’s operations (or at least a specific part of them). It provides field service company employees with the information and functions needed to manage the company’s operations.
2. Are there compliance requirements or other restrictions when using a field service management dashboard?
There can be, depending on the laws that apply to which industry you’re in and where you operate. Data protection regulations are generally the most relevant ones, as many dashboards are software provided by third parties, or even make use of cloud technologies. So you should research what’s required in terms of data storage, encryption, security, and employee use (i.e. who should and shouldn’t have access to sensitive data, and how those who do have access should handle the data).
It’s also a good idea to get dashboards that can automatically document any reports generated or other actions taken. That way, you’ll have a data trail that lets you show auditors you were using dashboards to improve your business’s efficiency in line with regulations.
3. What licensing structures are available for field service dashboards?
Some dashboards have a one-time license fee, and then can be used as long as they stay functional. Others adopt a subscription-based model, where you pay periodically and have access for the duration of the billing cycle (usually paying discounted rates for longer commitments). Still others use a “pay-as-you-go” model and charge based on usage, so you don’t have to pay upfront or commit to a set-length contract.
4. Why use field service dashboards? What’s the alternative?
Without field service dashboards, field service companies would have to manage the information and functions that dashboards handle in other ways. Examples include paper documents in physical file folders, general-purpose software (such as for word processing, spreadsheets, databases, etc.), or other kinds of management software solutions like field service CRM software.
The risk of using manual or multiple separate tools is that information can become scattered and inefficient to access. This leads to disjointed workflows, and makes data analysis very difficult and time-consuming. All of this makes your business slower and more resource-intensive, which is the opposite of what you want.
BuildOps, a field service management platform designed for commercial contractors, has built-in dashboard functionality. It allows for creating custom dashboards and generating reports from virtually any metric in minutes. It also pulls data for reports in real-time from your ongoing operations. All of this lets you stay on top of even the most complex commercial projects and daily work.