Top 9 Preventive Maintenance KPI Metrics To Track


Preventive maintenance performance metrics help commercial and field service contractors track maintenance processes, reduce equipment failures, and optimize maintenance schedules. But if not measured properly, a preventive maintenance strategy can quietly drift into routine work that nobody evaluates.
Selecting key performance indicators (KPIs) helps demonstrate whether the maintenance strategy actually reduces failures, saves customers money, and keeps the service team efficient. The right metrics turn routine service visits into measurable outcomes that prevent problems before they become expensive.
To show you what to track, how to track it, and see how much of a difference it can make to your bottom line, in this article, we’re going to cover:
- How to track preventive maintenance KPIs and metrics effectively
- How to calculate the ROI of your preventive maintenance program
- Top 9 preventive maintenance KPIs and metrics for field teams
- How to use preventive maintenance software to track KPIs
- How maintenance KPI tracking tools improve operational efficiency
Let’s get started with how to set this tracking up properly.
How to track preventive maintenance KPIs and metrics effectively
Most service organizations already track basic operational reporting like revenue, work orders, and technician hours. Measuring metrics effectively means building a reporting structure that isolates maintenance processes and connects them to equipment performance.
If your reporting system is already in place, setting up metrics to evaluate maintenance processes usually comes down to a few practical steps that make reporting practical and actionable instead of theoretical:
- Separate preventive and reactive maintenance work
- Link maintenance activities to equipment performance
- Track technician labor, maintenance hours, and materials usage
- Monitor equipment downtime and asset availability
- Compare planned maintenance versus reactive maintenance
Why preventive maintenance metrics are critical for operational efficiency
Metrics for a maintenance strategy bring clarity to work that’s often invisible when it’s done correctly. When contractors track these numbers consistently, they move from reacting to problems to actively managing equipment performance. Setting this tracking up properly will help you:
- Reduce emergency service calls through planned maintenance
- Improve asset reliability and equipment effectiveness by catching performance changes before failures occur
- Optimize technician productivity and maintenance scheduling by balancing preventive and reactive work
- Demonstrate preventive maintenance ROI to customers when they invest in maintenance contracts
- Control maintenance costs through KPI tracking to make smarter repair and replacement decisions

Key data sources for tracking KPIs
The good news is that most data needed already exists in normal service operations. Field technicians generate it every day through work orders, inspections, and service reports. Key data sources typically include:
- Work order records that track preventive maintenance
- Logged technician hours for accurate maintenance metrics
- Tracked maintenance materials and component costs tied to specific service visits
- Recorded inspection results that monitor asset reliability
- Logged equipment performance history showing failures and repairs
- The equipment downtime percentage documenting equipment outages
- Reported service requests that signal unexpected failures
When this information is organized in a centralized system, it becomes the foundation for reporting.
How to calculate the ROI of your preventive maintenance program
Preventive maintenance costs include labor time spent performing inspections, replacing components, documenting equipment conditions, and materials used throughout the day. The return on investment in a maintenance strategy comes from avoiding larger problems.
Measuring ROI means comparing the cost of prevention against the cost of failure. In many cases, preventive maintenance processes pay for themselves by reducing expensive breakdowns and extending equipment lifespan.
Step 1: Calculate total preventive maintenance costs
Add together the direct costs of the maintenance program, which typically includes technician labor, replacement parts, and administrative overhead tied to scheduling and documentation.
Step 2: Compare planned versus reactive maintenance expenses
Look at past service records to determine the cost of reactive repairs. Emergency labor, replacement equipment, and downtime-related expenses provide a baseline for comparison.
Step 3: Track equipment failures and downtime trends
If the strategy is working, the number of equipment failures should decrease over time, which represents avoided repair costs.
Step 4: Measure the ROI of preventive maintenance programs
Once the cost of prevented failures is estimated, compare those savings against the cost of running the maintenance program.
Top 9 preventive maintenance KPIs and metrics for field teams
Planned maintenance KPIs help contractors understand whether their field teams are maintaining assets effectively and keeping systems reliable. These are the actual metrics that will show you whether the maintenance strategy is doing its job.
1. Planned maintenance percentage (PMP) versus reactive maintenance percentage (RMP)
This metric compares the amount of scheduled maintenance work to emergency repair work. Planned maintenance percentage (PMP) measures how much of total maintenance work is scheduled in advance rather than triggered by a failure. Reactive maintenance percentage (RMP) shows how often technicians are responding to equipment failures instead of preventing them.
A healthy service operation typically has a higher planned maintenance percentage due to completing more planned maintenance than emergency repairs. When reactive work begins to dominate the schedule, it often signals that preventive programs need improvement.
How To Calculate: Preventive vs. Reactive Ratio = Preventive Maintenance Work Orders ÷ Reactive Service Work Orders
2. Measuring mean time between failures (MTBF)
MTBF tracks the average time equipment operates before experiencing a failure. A rising MTBF indicates equipment is operating longer without problems. A good maintenance strategy should gradually increase this number as assets become more reliable.
How To Calculate: MTBF = Total Equipment Operating Time ÷ Number of Failures
3. Tracking equipment uptime and availability
Equipment uptime measures the percentage of time assets remain operational. High uptime means equipment is consistently available for use. Preventive maintenance programs aim to maximize this number by preventing unexpected outages.
How To Calculate: Equipment Uptime = Operational Time ÷ Total Available Time × 100
4. Monitoring equipment downtime percentage
Equipment downtime percentage measures how often an asset is unavailable because it’s broken, being repaired, or otherwise out of service.
Downtime directly impacts customer operations. Monitoring this metric helps contractors identify assets that require improved maintenance strategies.
How To Calculate: Equipment Downtime = Total Hours Equipment Is Out of Service
5. Preventive maintenance compliance rate
This KPI tracks how often scheduled maintenance visits are completed on time. Compliance ensures preventive tasks happen when they should.
How To Calculate: PM Compliance Rate = Completed PM Work Orders ÷ Scheduled PM Work Orders × 100
6. Maintenance backlogs and service request volume
This KPI tracks the number of requests waiting to be scheduled or completed. A growing backlog can indicate that equipment failures are increasing faster than the service team can respond.
How To Calculate: Service Call and Maintenance Backlog = Total Open Service Requests
7. Maintenance reschedule rate
The reschedule rate tracks how frequently service visits must be moved to a different date. High reschedule rates often signal scheduling pressure caused by emergency repairs that interrupt consistent maintenance.
How To Calculate: Reschedule Rate = Rescheduled Jobs ÷ Total Scheduled Jobs × 100
8. Maintenance technician productivity and on-time completion rate
These KPIs measure how often service visits are completed within their scheduled time windows. Frequent delays can indicate operational strain caused by unexpected equipment failures.
How To Calculate: On-Time Completion Rate = On-Time Jobs ÷ Total Jobs × 100
9. Customer satisfaction score (CSAT) for maintenance services
CSAT measures how satisfied customers are with the service they receive. Equipment failures disrupt operations. When programs fall short, customer satisfaction usually follows.
How To Calculate: CSAT = Total Positive Customer Ratings ÷ Total Survey Responses × 100
{{related-content-block="/resources/field-service-metrics-kpis"}}
How to use preventive maintenance software to track KPIs
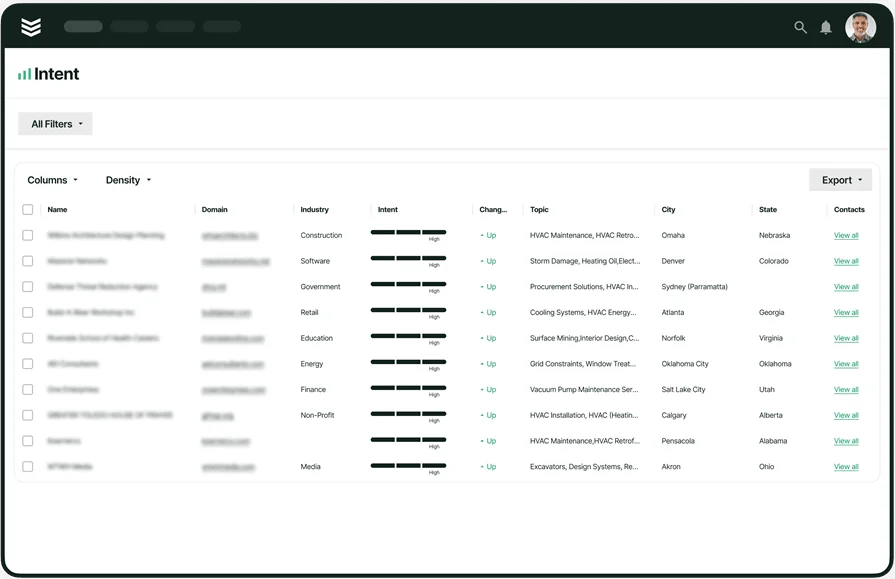
Tracking KPIs becomes much easier when all operational data lives in one place. That’s why many commercial contractors rely on platforms like BuildOps to manage service operations and reporting.
BuildOps connects every piece of field activity—work orders, technician labor, asset history, materials usage, and service schedules—into a single operational system. Because the platform tracks work at the asset level, it becomes possible to measure maintenance performance metrics across entire equipment portfolios.
Every field captured in BuildOps, from technician notes to inspection results, can be used to generate reports. This flexibility allows field service contractors to build dashboards tailored to their programs instead of forcing their operations to fit rigid reporting structures. In practice, this allows teams to focus on the exact metrics that matter most to their service strategy.
How maintenance KPI tracking tools improve operational efficiency
A strategy works best when it’s consistent, disciplined, and measured. Without the right metrics, maintenance programs quietly drift into routine activity that nobody evaluates. KPIs bring structure to that process. They reveal whether maintenance schedules are working, equipment reliability is improving, and service teams are operating efficiently.
For commercial and field service contractors managing thousands of assets across multiple customers, that visibility makes all the difference.
Platforms like BuildOps help make maintenance measurable by connecting field operations, asset history, and reporting into a single system. With real-time dashboards and customizable reporting, contractors gain the insight needed to track performance, reduce downtime, and prove the value of maintenance programs.
When maintenance is measured properly, it stops being routine service work and becomes something much more powerful: A strategy for keeping critical systems running and the businesses that rely on them moving forward.