FIELD SERVICE REPORT SOFTWARE
Turn field data into financial truth
Most contractors find out what went wrong at month-end, when it is already too late to act. BuildOps gives you real-time dashboards, job-level financials, and AI-driven insights so you catch margin drift and billing lag while there is still time to fix it.
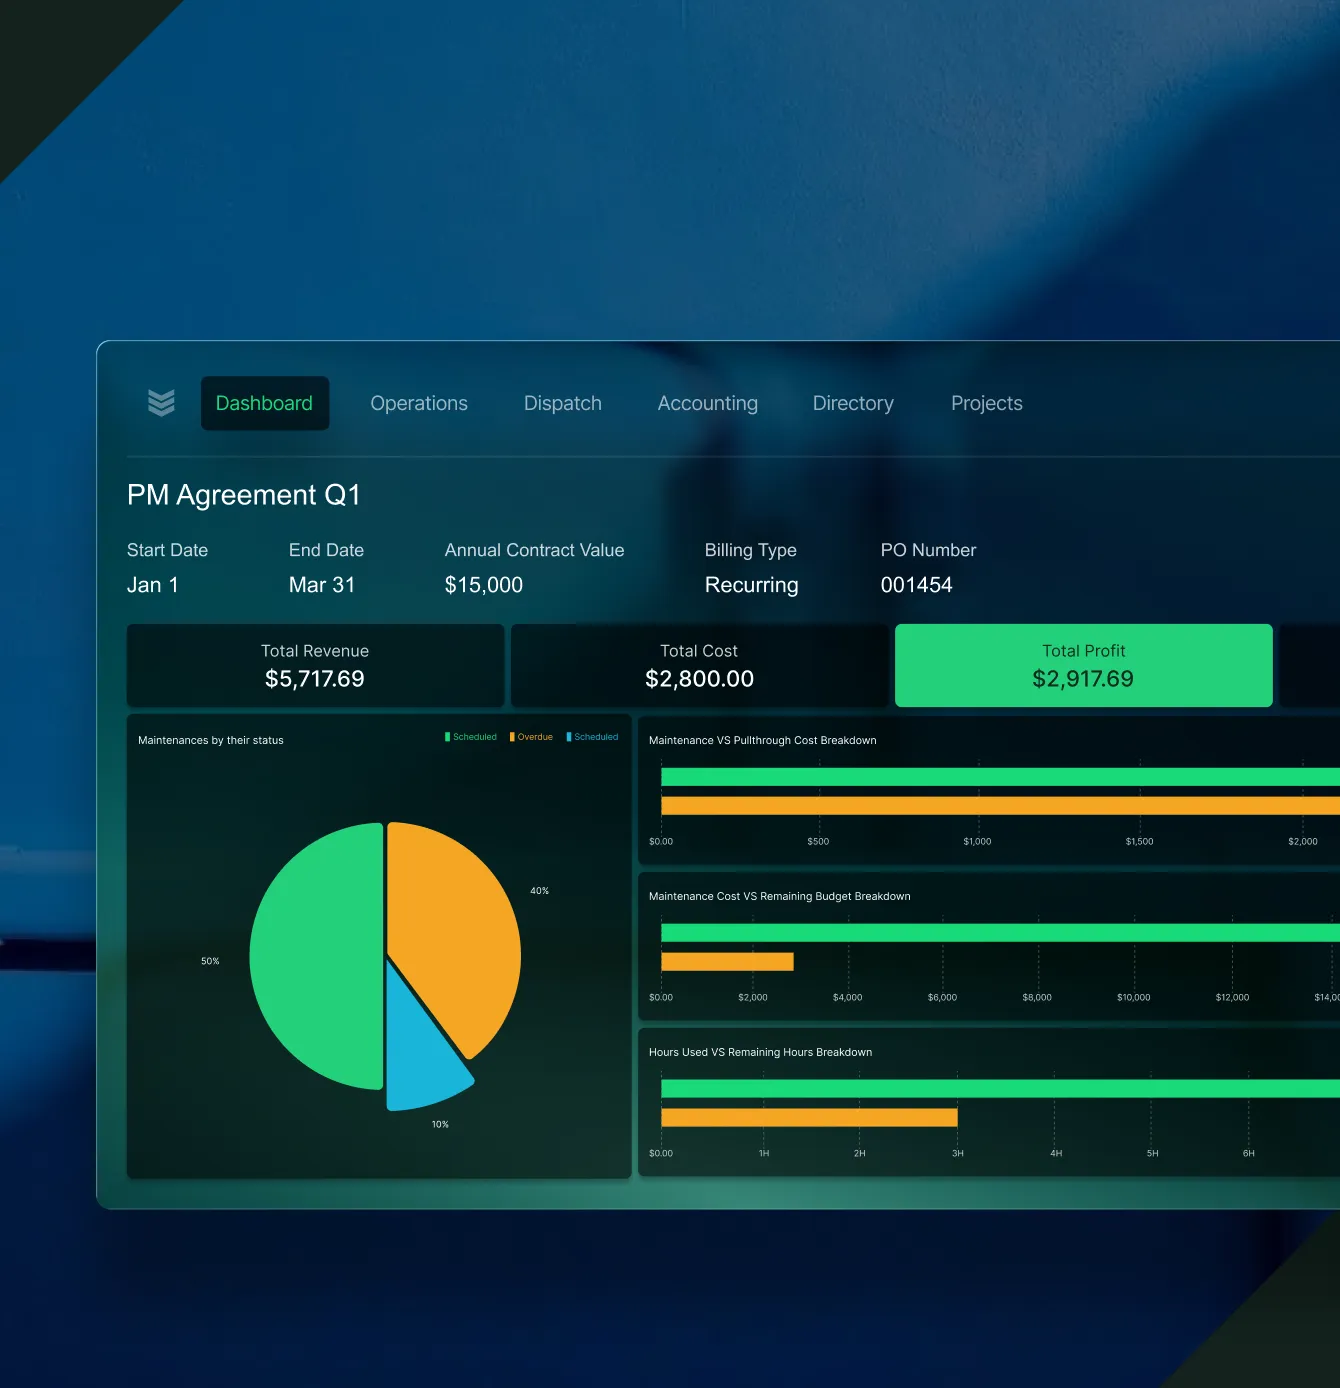



One System, Every Workflow
Real-time reporting across service and projects
Go beyond spreadsheets. BuildOps connects operations, financial, and field data into dashboards every role can act on from the dispatch desk to the boardroom.
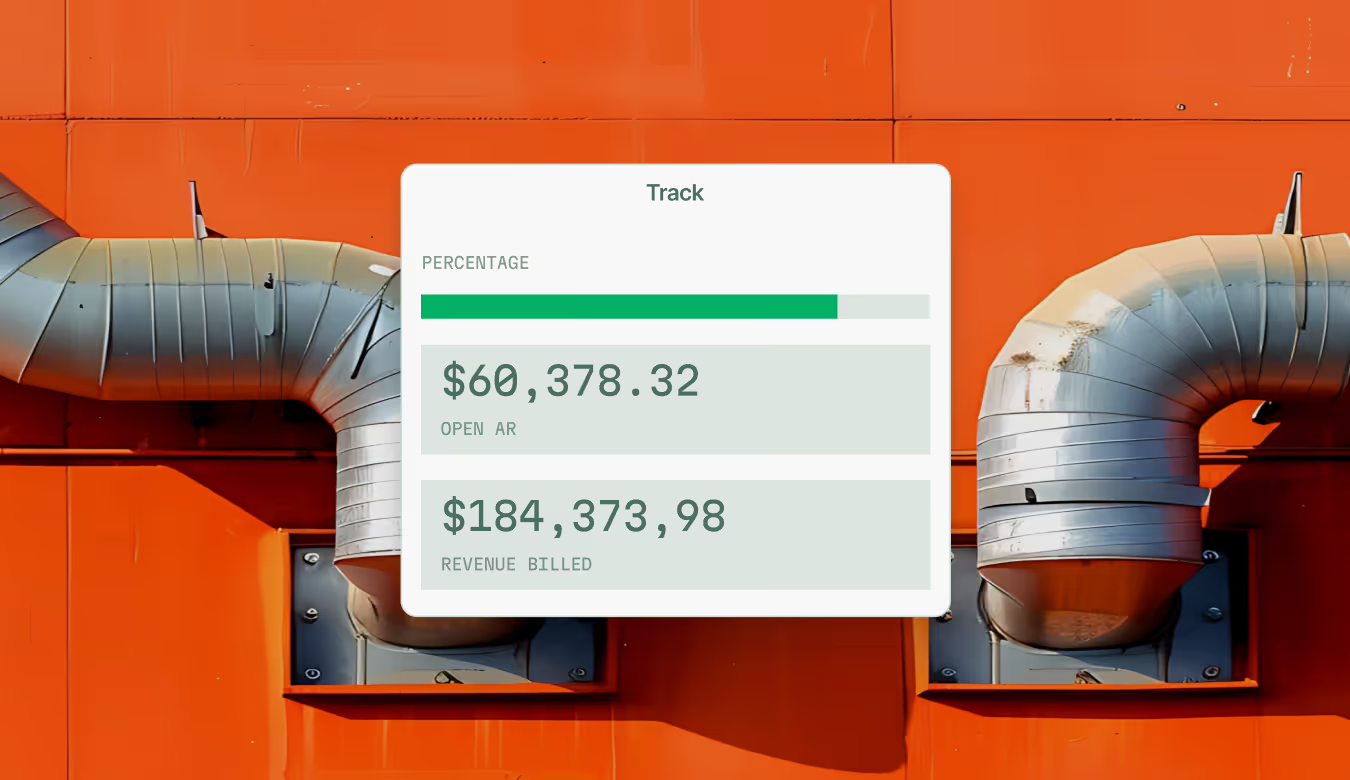
Ops Dashboard
See pipeline, service volume, project margins, and labor utilization at a glance. One real-time view that gives owners and ops leaders the same financial truth.
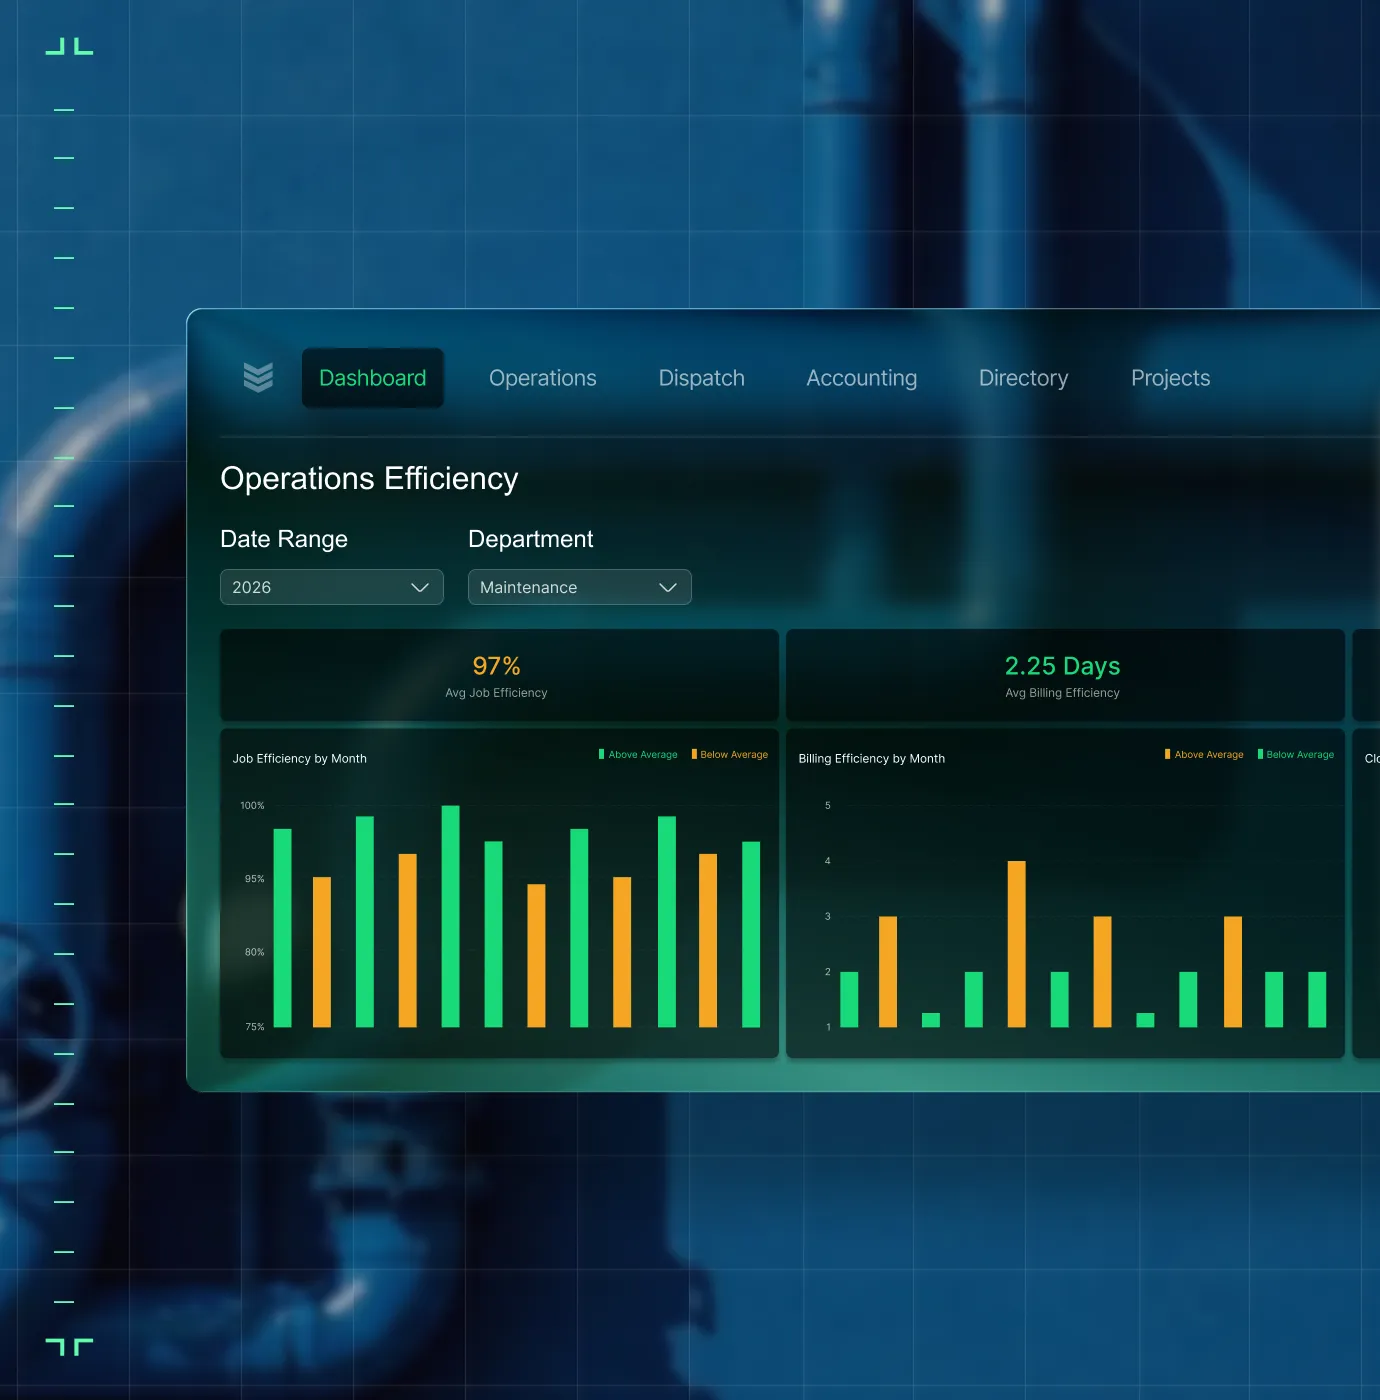
Job Health
Track cost, margin, labor burn, and billing progress right inside the job before you send the invoice.

Custom Reports
Build saved views by role: quick filters for auditing, overdue invoices, and technician performance. No manual exports.

Project Analysis
Month-by-month billing, costs, profitability, and over/underbilling all in one connected report.

Financial Reports
WIP accuracy, billed-vs-cost tracking, and billing alignment, the numbers your CFO actually needs.
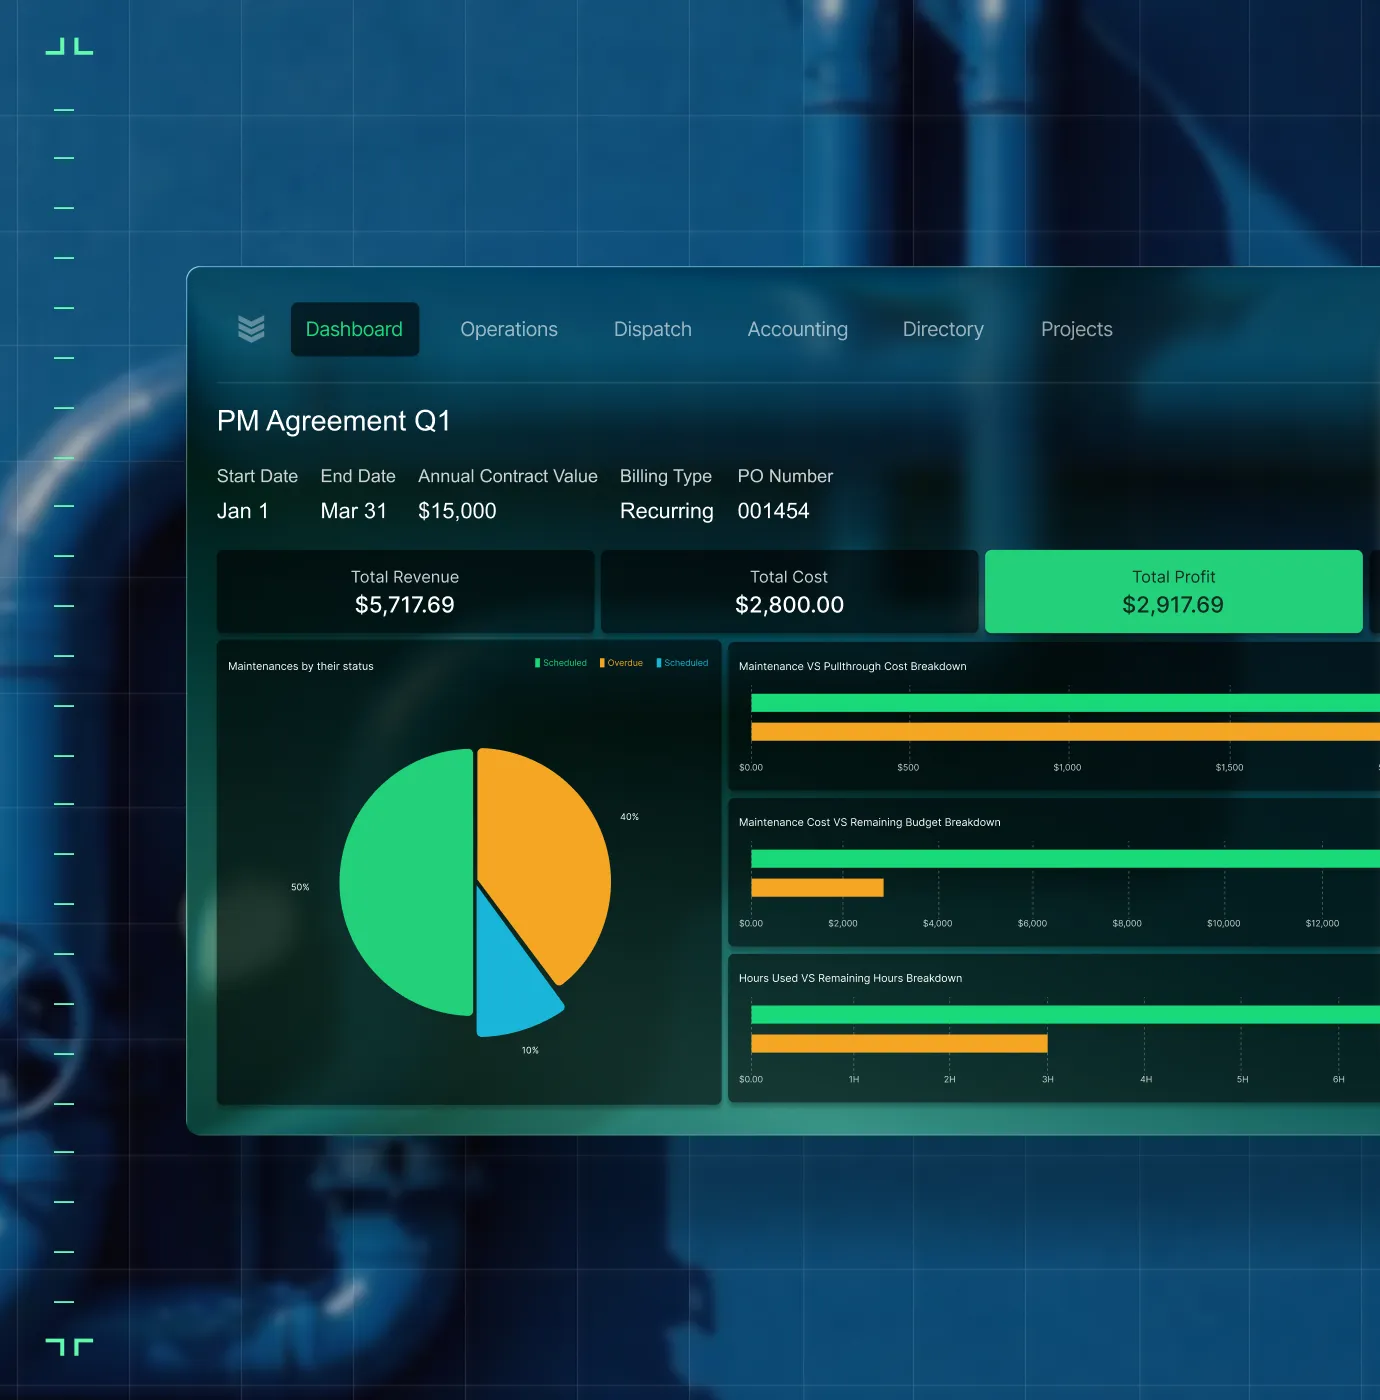
Labor Analytics
Track productivity, utilization, and technician profitability by crew, by branch, by job.

OpsAI
OpsAI surfaces overdue invoices, upsell signals, and answers operational questions on the spot.


Proven Results
Real-world impact for commercial leaders


"We've seen an increase in day-to-day operations efficiencies that's going to add up to significant savings in time and energy over the course of a year."

"If we didn't have BuildOps and the additional cyber security they give our company, we would be dead in the water."

"The ability to produce reports either on an individual job basis, a quarterly basis, or a project basis is something we'd never seen before in other software that we've used."

"We've cut down in our receivables from about 120 days to 30 days on average."


"Before we knew it, we were seeing quicker turnaround times on job closeout and a huge improvement in the time it took for quotes to be accepted by our customers."


"With BuildOps, we feel like we can go after anything. The sky is the limit as far as the size of the project."
.webp)

"BuildOps gave us an all‑in‑one system for both service and projects. Once we saw that, it was a no‑brainer."

"With the integration of BuildOps and Sage Intacct, our accounting system, we've been able to speed up the time it takes for us to bill customers."


"Our consulting division increased 300% because we were able to free up more time from the office to help other customers."
![Service First Logo]](https://cdn.prod.website-files.com/69cad9cd3a5ef3196ea9bb65/69fa0ca0adc28a56d26717c9_Service%201st%20white.webp)
"Sometimes systems promise you the moon, then you use them and see the weaknesses. It's been the exact opposite with BuildOps. Everything we wanted it to do, it could do."
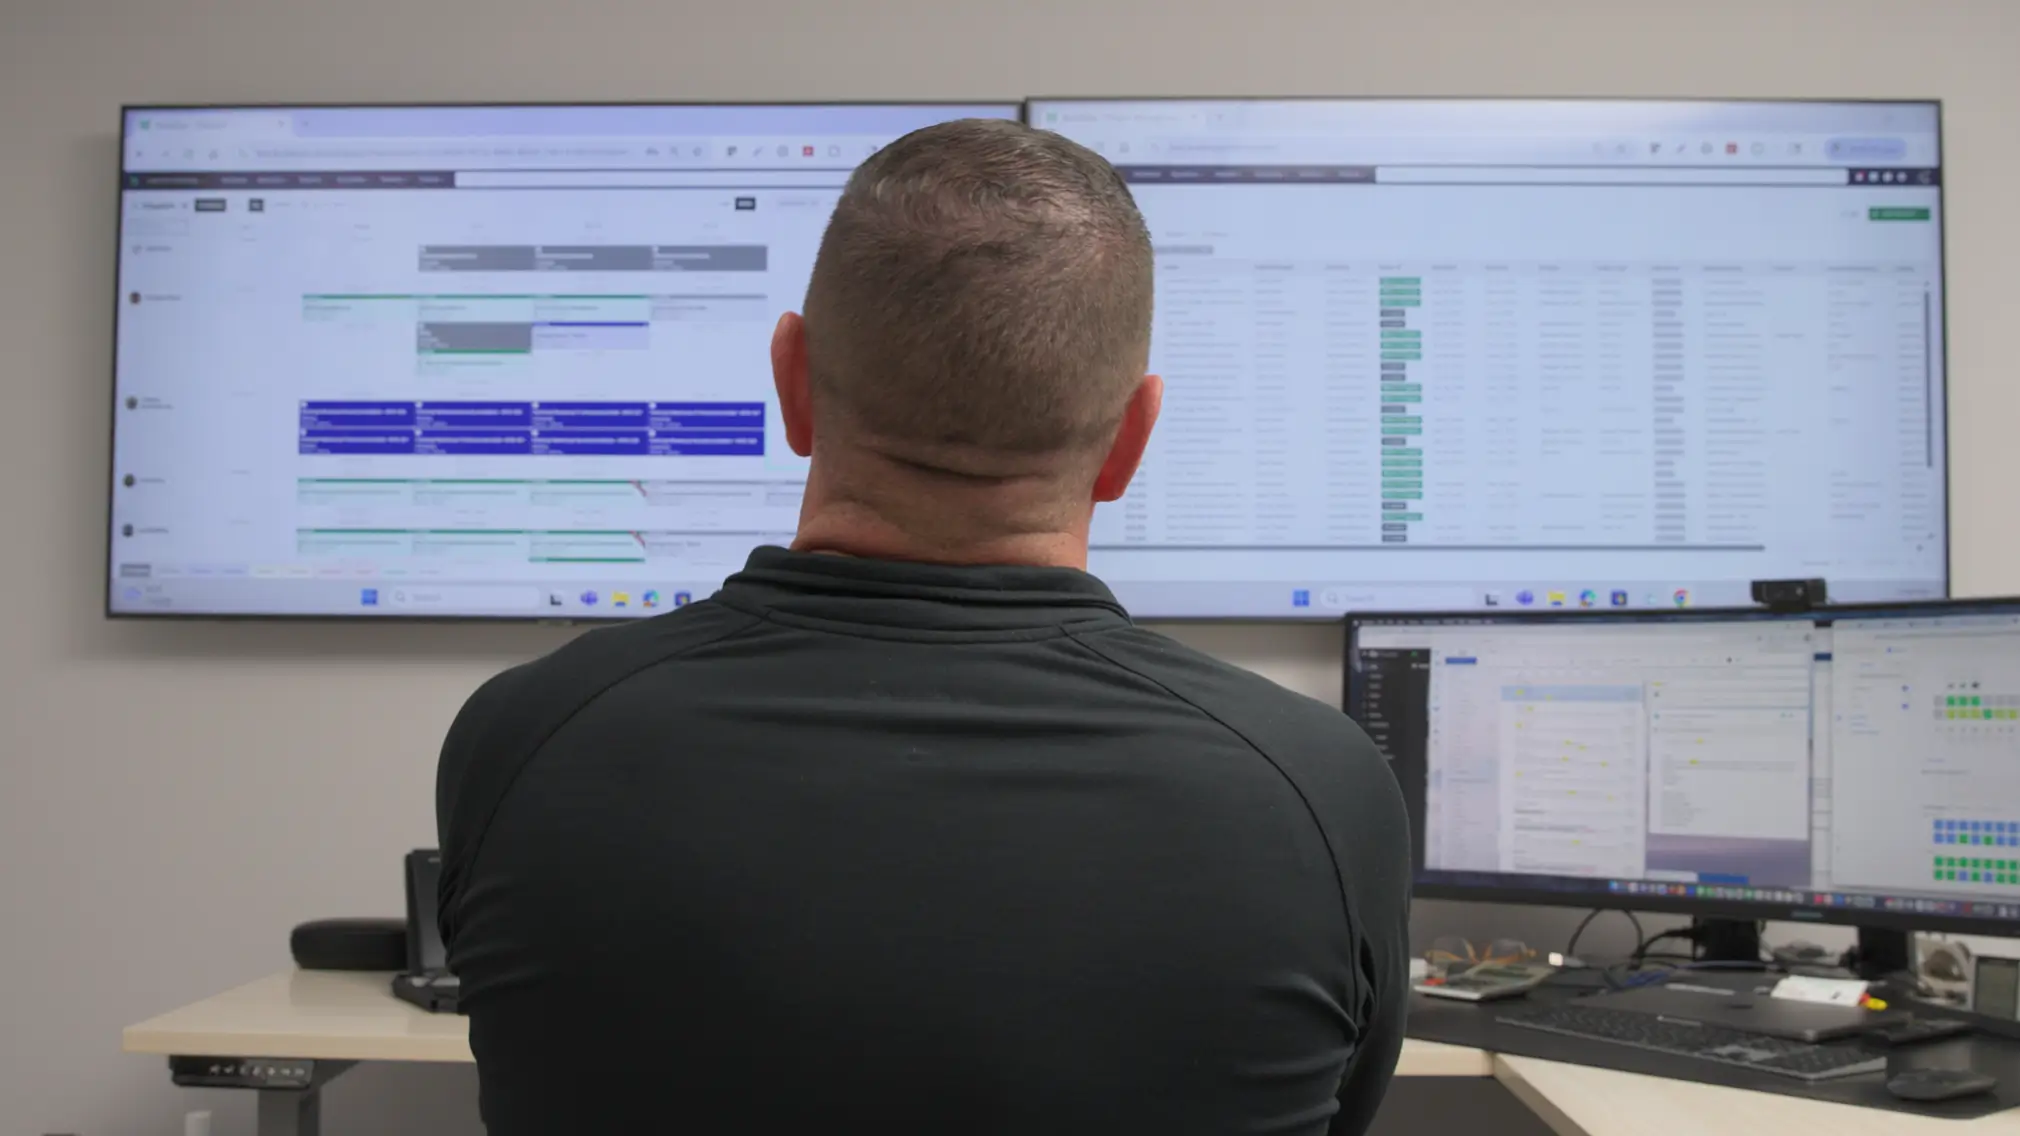

"We used to be two weeks behind on job costing. Now we're up to date daily."
What makes BuildOps different
Built from the ground up for contractors who run projects, service, and everything in between. Not adapted. Made for the work.
Commercial work isn't an add‑on
Most platforms started in residential and stretched to fit. BuildOps starts with the complexity of commercial work.
Run the work in one connected system
Field, office, finance, and sales — all in one place. No duct-taped tools, no double entry, no dropped balls.
OpsAI is built in, not bolted on
OpsAI is already in your workflows. It recaps the day, calls out risks, and gives every role a clear next step.

Zero-Downtime Migration
Bring your data over without the interruption
The biggest risk to your business is staying on a broken system. Our implementation team makes sure your historical data and active reports move to BuildOps with zero downtime for your field or office crews.
Historical data integrity
We map your legacy reporting data so every past job is searchable and accurate inside the new system.
Active project transition
Current dashboards and scheduled reports are moved in phases so your team never loses visibility.
ERP backbone sync
We handle the complex handshake with your accounting software so your ledger stays the single source of truth.
Reporting
Live dashboards and reports for every job and crew.
Common Questions
Your questions on field service report software, answered
What reporting features does BuildOps offer that are especially useful for commercial contractors?
When it comes to commercial work and large-scale projects, one-size-fits-all reporting doesn’t cut it. These are the reporting features that are critical for commercial teams:
- Real-time operations dashboard—Sales pipeline, service volume, and labor utilization, all connected, all in one place, all with up-to-date data.
- Financial source of truth—All team members see the same information, because it’s all up to date for everybody. All teams update data in one place, even through integrated tools like QuickBooks through a bidirectional sync, so everyone sees the same financial truth.
- Custom saved views—Build your own saved views by role and quick filter what you need. No need for manual exports.
- AI-powered insights—A tool that can surface overdue invoices, recommended work techs can upsell, and can answer any financial questions on the spot.
- Job health metrics—You want the ability to track costs, margin creep, labor usage, and billing progress inside your jobs before you send invoices.
- Project analysis reports—Month-by-month billing, costs, profitability, and over/underbilling all in one connected report.
- Labor analytics—Track profits, tech usage, and productivity how you need: by job, by location, by crew, and so on.
What are the key benefits of using field service report software for commercial teams?
Real-time field reporting cuts end-of-month surprises, eliminates manual exports, and helps you identify margin issues before they compound. Field service reporting software connects field data to financials automatically, so you make faster decisions without waiting on finance.
Can I build custom reports in BuildOps? How flexible are they?
Yes. you can filter, save, and share report views that are completely tailored to your role, and the roles of your team members. Whether you're tracking overdue invoices, technician profitability, or job cost variance, you can stop with spreadsheet exporting or manual rollups.
The level of customization available in BuildOps for reporting is one of the features our commercial customers love the most, because they find that other tools often just don’t fit for commercial work. As our customer Austin Hamlin from Certified Fire puts it: “A lot of alternatives treat a $1m project the same as a $2k service.” We think that just doesn’t cut it when it comes to the needs of commercial construction reporting.
Does BuildOps reporting work with my ERP?
BuildOps integrates with the ERPs frequently used by financial teams including Sage, Viewpoint, and Quickbooks. BuildOps syncs field data (time tracking, POs, invoicing, etc.) directly with your ERP's job costing and payroll modules. Data flows both ways, keeping financials accurate without manual re-entry.
BuildOps is an operational backbone for commercial financial teams to build on top of, no matter what other tools are in your tech stack.
How does OpsAI improve reporting for commercial contracting teams?
OpsAI surfaces patterns your team would otherwise have to dig for: overdue invoices, upsell signals, productivity gaps, and job data that feeds cost tracking and reporting. Instead of spending time in sorting through data, your team acts on what OpsAI already surfaced.
What BuildOps reporting is available on the mobile app?
Techs log time, capture photos, and complete forms from mobile. That data feeds directly into dashboards and reports, giving the office real-time field visibility without waiting on paperwork or callbacks.
Can BuildOps handle reporting for both service and project work?
Yes. BuildOps reports span service, maintenance, and construction, all from the same data layer. One reporting view across dispatched calls, ongoing service agreements, and long-cycle construction projects.