Wrench Tax: Where Your Techs' Time Goes and How to Get It Back
Best‑in‑class contractors generate about 65% more revenue per technician with the same headcount.

Every owner knows the feeling: the calendar is full, the crews are busy, and yet the profit at the end of the month does not look like a shop that is "slammed." Somewhere between what your technicians do with a wrench and what shows up on the P&L, value is leaking.
That leak is what we call wrench tax – the invisible percentage of a technician's paid day that disappears into paperwork, rework, waiting, and chasing information instead of billable work.
BuildOps’ Benchmark Report: Torque 2026 shows that across more than 1,500 commercial contractors, best‑in‑class contractors generate about 65% more revenue per technician with the same headcount.
If you are paying for eight hours but only getting six or less in true billable output, wrench tax is what is eating the rest.
The field‑productivity gap in numbers
Field productivity is where wrench tax shows up first and where the upside is clearest.
In the benchmark data, best‑in‑class contractors:
- Generate roughly 65% more revenue per technician than the platform average across trades.
- Complete 34% more work orders per technician per day (1.55 per day vs. 1.16 at the average).
- Close jobs 48% faster, cutting average days to complete from 21.6 to about 11.
Put that in the context of a typical mid‑sized commercial shop:
- At a $150 blended billable rate, just 20 minutes a day lost to paperwork, phone calls, or parts issues burns about 85 billable hours per tech every year.
- In a 20‑tech operation, those 85 hours each add up to nearly $255,000 in lost annual revenue capacity – before you even look at the downstream impact on callbacks, overtime, and customer satisfaction.
Wrench tax is not a tech‑effort problem. It is a system design problem.
Where wrench tax hides in a commercial shop
Owners and executives usually feel wrench tax before they can see it on a dashboard. The symptoms are familiar:
- Crews are constantly busy, but revenue per tech and gross margin stay flat.
- The daily board is packed, but call‑backs, revisits, and overtime keep creeping up.
- Dispatchers and coordinators are overwhelmed, even as back‑office headcount grows.
Underneath those symptoms are a handful of familiar patterns.
1. Paperwork that trails the work
When job documentation is finished in the truck or back at home – or worse, handed in on paper – you pay twice:
- First, in lost billable minutes every day as techs type, rewrite, or chase missing details.
- Second, in slow job close‑out as office staff wait on notes, photos, signatures, and PO numbers that should have been captured on‑site.
Jobs that drag stay open on the board, tie up crews, and delay the next billable visit. Best‑in‑class operators flip this by having techs complete structured digital work orders in the field, with required fields enforced at close, so the paperwork can’t lag behind the work.
2. Chasing information instead of fixing problems
Every time a technician calls the office for site history, equipment records, or pricing, wrench tax ticks up.
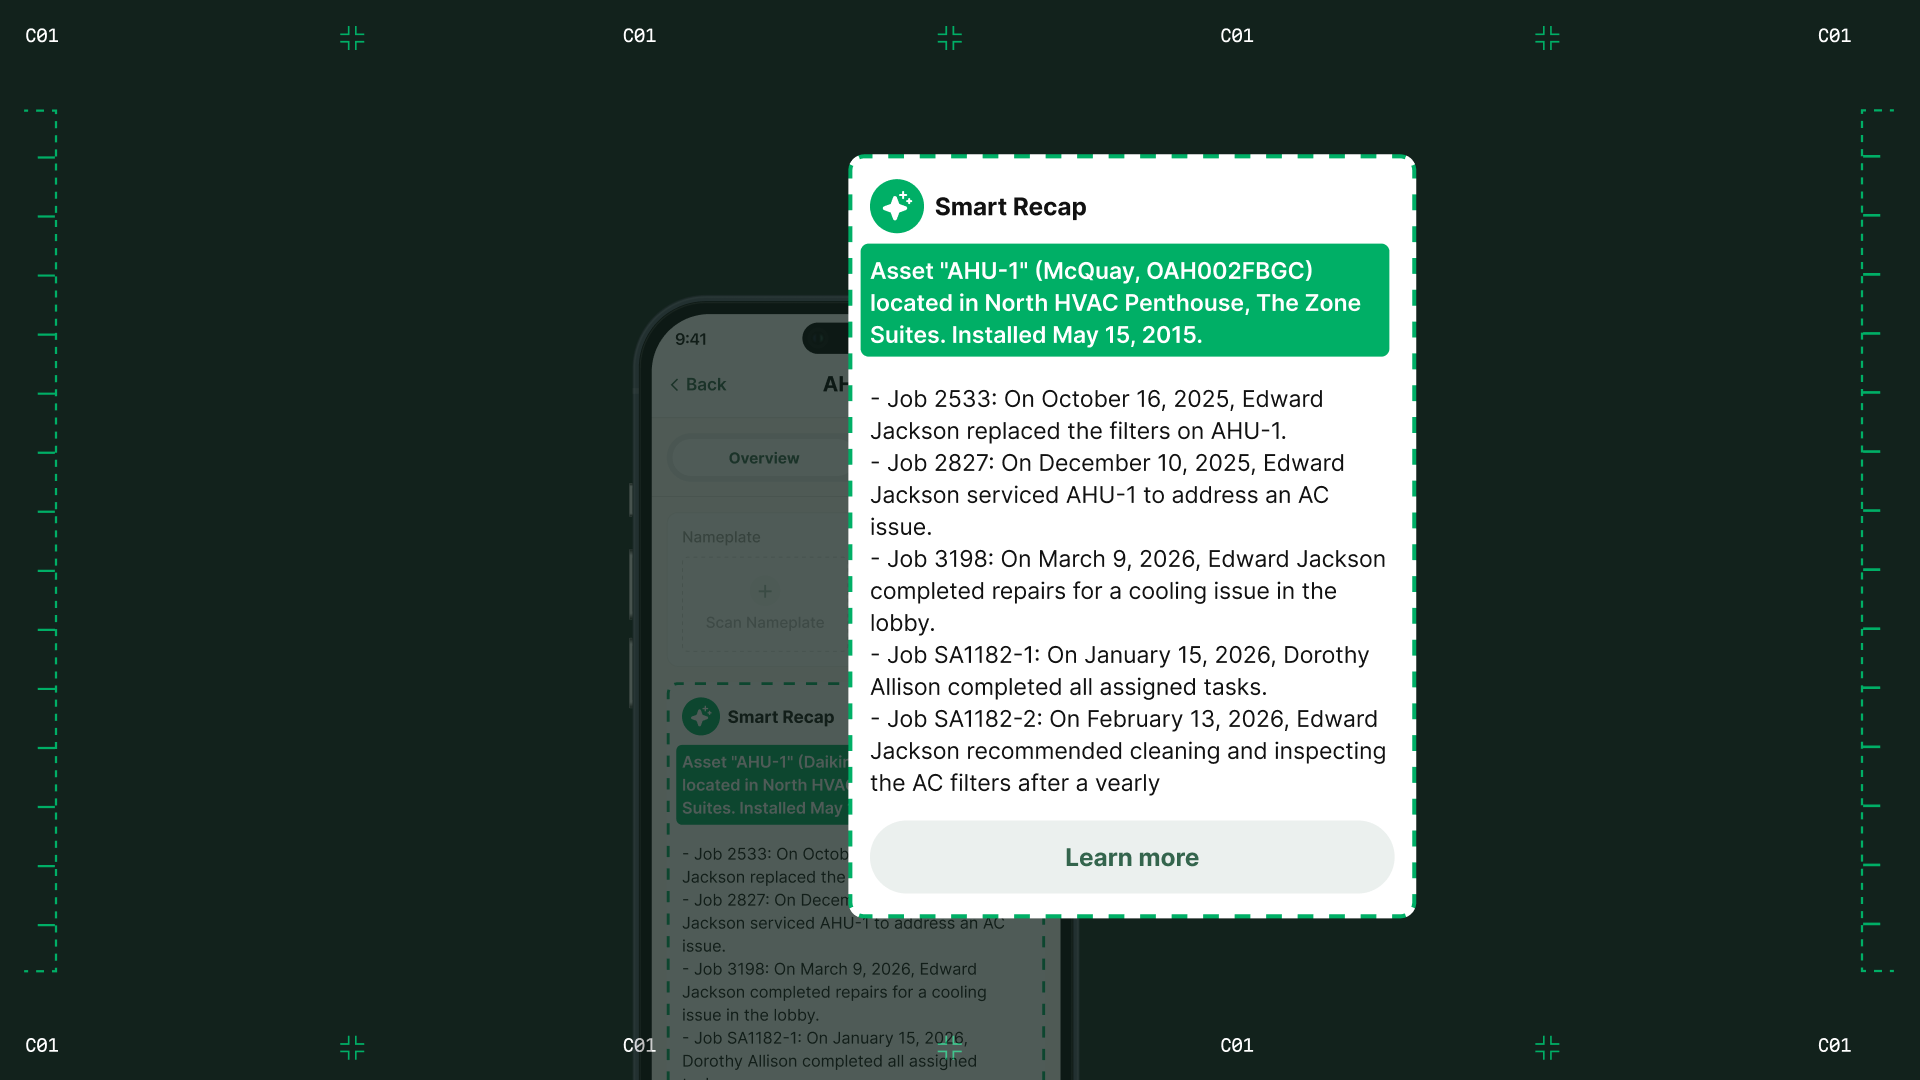
Best‑in‑class operators reverse that pattern by putting everything the tech needs in their hand, job history, photos, equipment, and live pricing, through a connected mobile app. The result shows up directly in revenue per tech and faster job completion.
3. Dispatch and routing that waste the day
Wrench tax also lives in the gaps between jobs:
- Extra windshield time because routes were not optimized.
- Wrong tech on the wrong job, forcing a second visit.
- Unplanned returns for missing parts or tools.
4. Office overhead that grows faster than the field
Finally, wrench tax shows up as overhead.
At the platform average, one back‑office employee supports about 4.77 technicians. Best‑in‑class operators run closer to 6.75:1 – about 42% more field capacity per coordinator, dispatcher, and billing resource.
If every new tech forces you to add back‑office headcount, your system is charging you wrench tax on both sides of the house: in lost field output and in margin eaten by overhead.
What best‑in‑class contractors do differently
The contractors at the top of the industry are not working harder; they are running a different system.
At a high level, leaders in the data set:
- Protect technician time as their scarcest asset and design workflows to strip out admin and rework.
- Close the field‑to‑office gap with one connected platform so jobs, documentation, and scheduling move together.
- Use AI to shave minutes off repetitive tasks so techs and coordinators can stay focused on work that pays.
Turning the benchmark into your field‑productivity roadmap
For owners and executives, the question is not whether wrench tax exists in your business, the report makes it clear that it does for almost everyone.
The question is how big your gap is, and where to start.
Wrench tax will not show up as a line item on your financials. But once you see it in the numbers and start measuring your performance against peers who have already closed the gap, it becomes one of the most powerful levers you have.
The Benchmark Report: Torque 2026 is the starting point. The upside sits in the space between where you are today and the best‑in‑class lines you could be running tomorrow.