120 Days to 30 DSO. 44% Increase in Revenue Growth. What These Contractors Changed.
Seven commercial contractors share how they cut collection time, grew revenue per tech, and closed more quotes.
"We're twice as fast getting invoices out,” says Erika Collazo, Office Manager at Service 1st.
That kind of speed is one of the clearest differences between high-performing contractors and everyone else. It is not abstract—it shows up in the numbers. The Torque 2026 Benchmark Report measured it across 1,500+ contractors in North America, and the distance between the average contractor and the top 20% is wide enough to reshape a business.
Cash velocity
The first place that difference shows up is cash flow.
“When we go to write an invoice, it's already 75% done, 80% done,” says Jonathan Clark, Owner at Omnia Mechanical.
That level of preparation changes what happens after the work is done. Omnia Mechanical cut its AR period from 120 days to 30.
“We've been able to speed up the time it takes for us to bill customers,” says Arik DeCleene, CFO of Rabine Group.
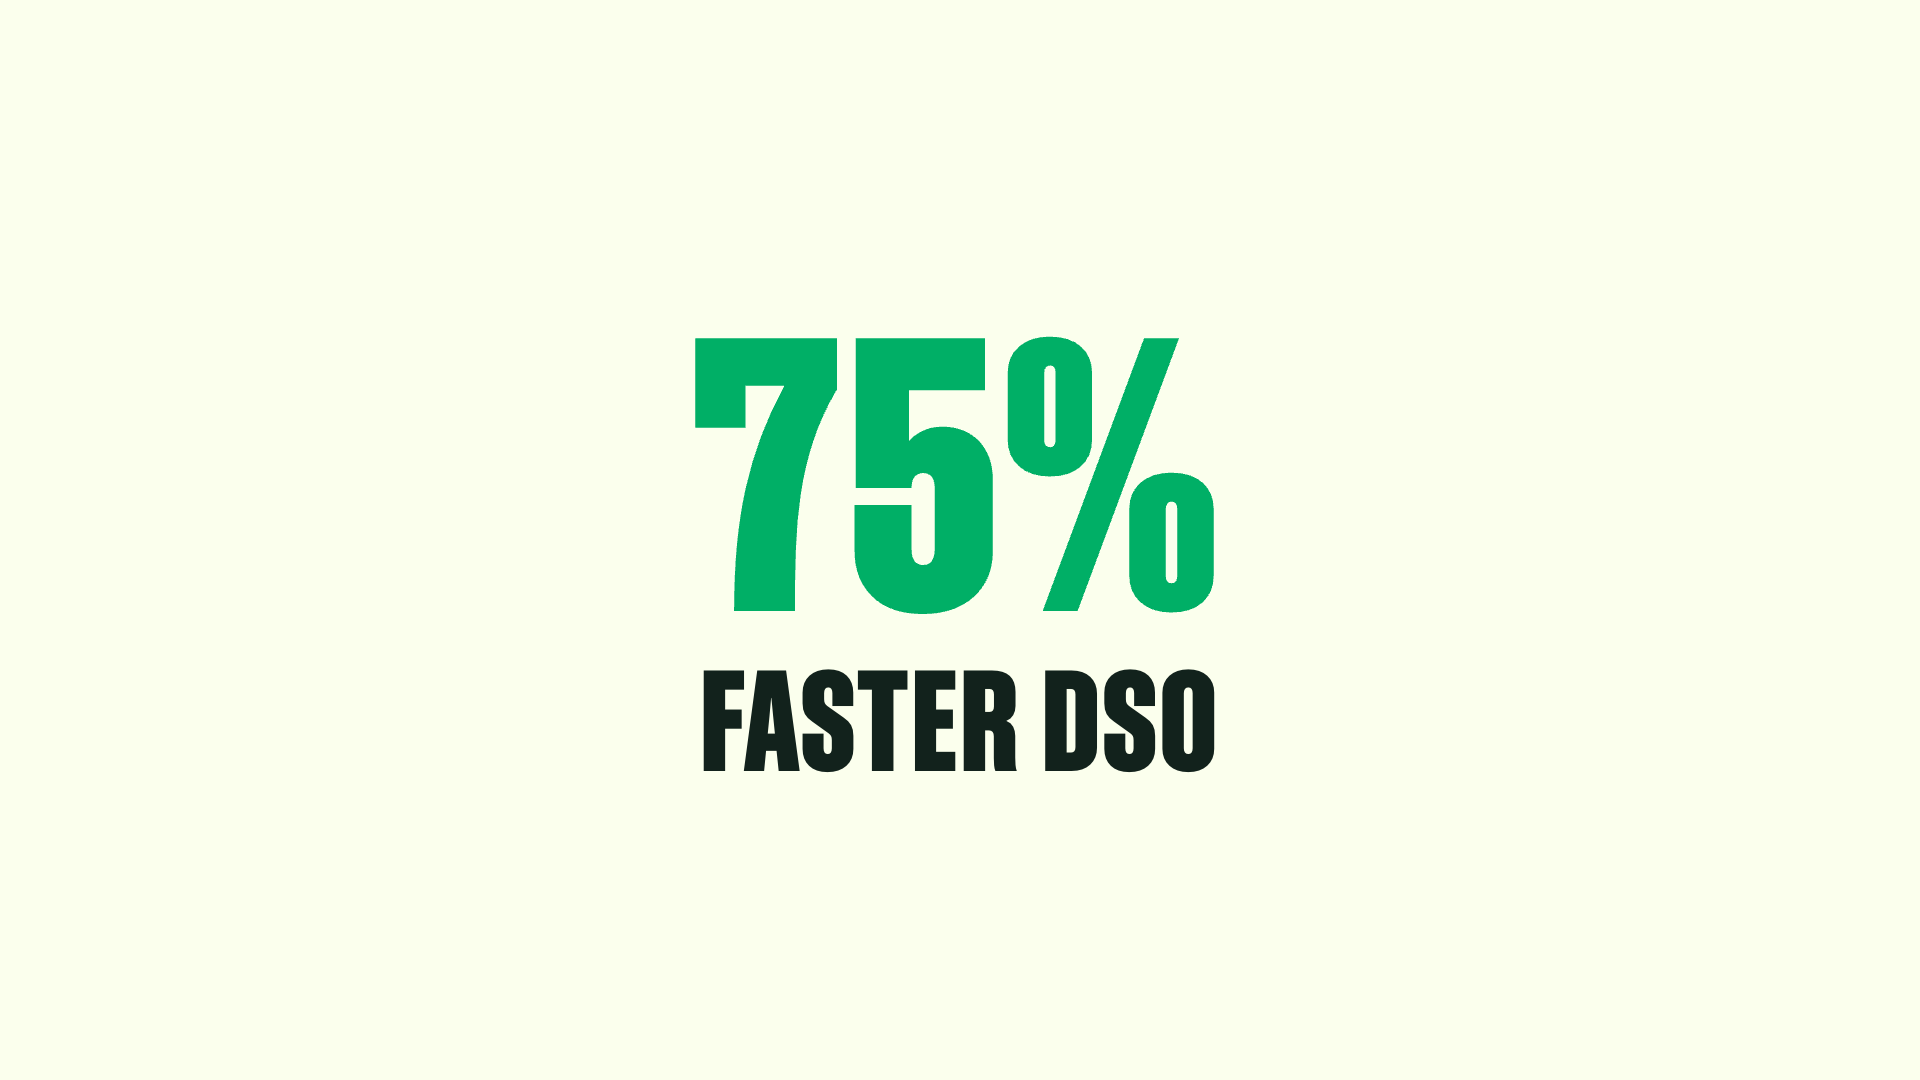
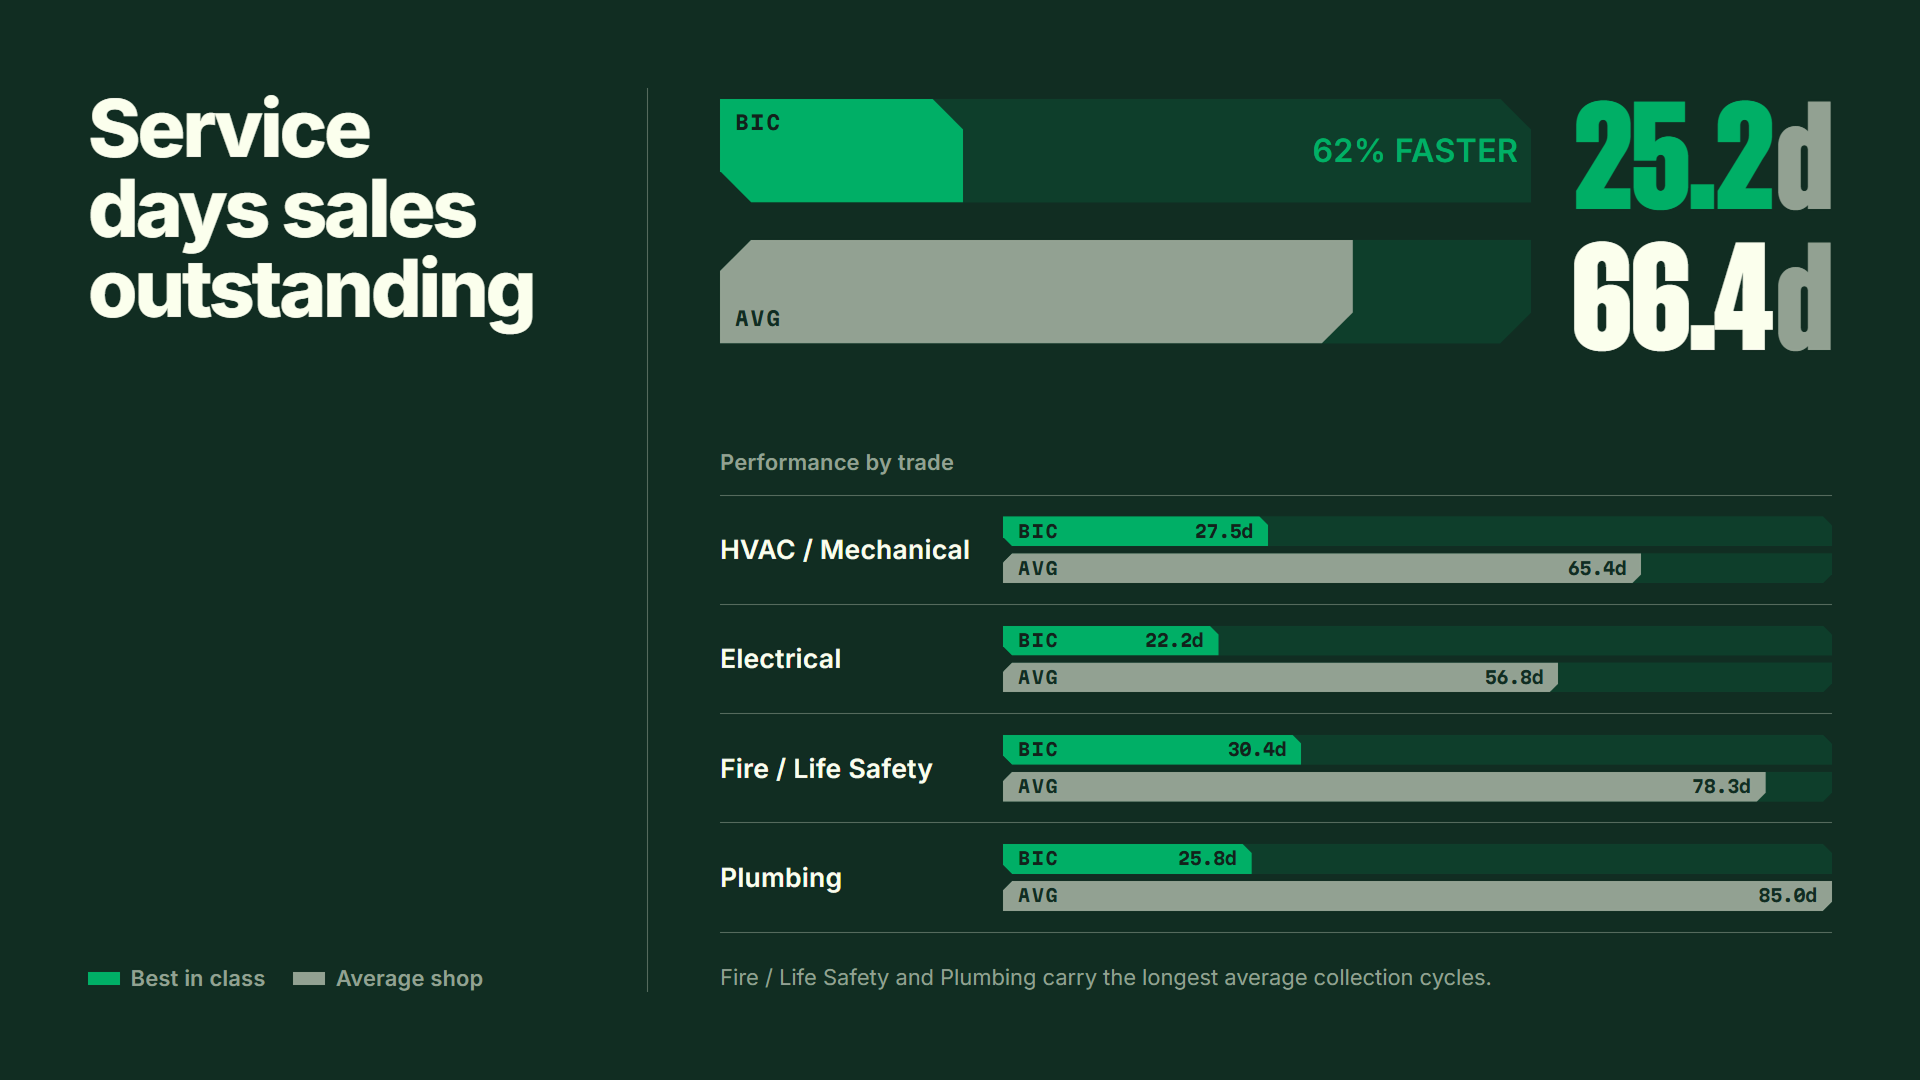
Together, these examples show why billing speed is more than an accounts receivable metric. The benchmark: the average contractor takes 66.4 days to collect. The top 20% collect in 25.2 days: 62% faster. That difference points to a documentation and billing-cadence problem that best-in-class operators have solved at the point of work.
Field productivity
When technicians have the information they need in the field, work moves forward without as many office handoffs.
For Layer One, that visibility changed the pace of job costing. The company used to run two weeks behind. “Now we're up to date daily,” says Jason Thompson, Founder.
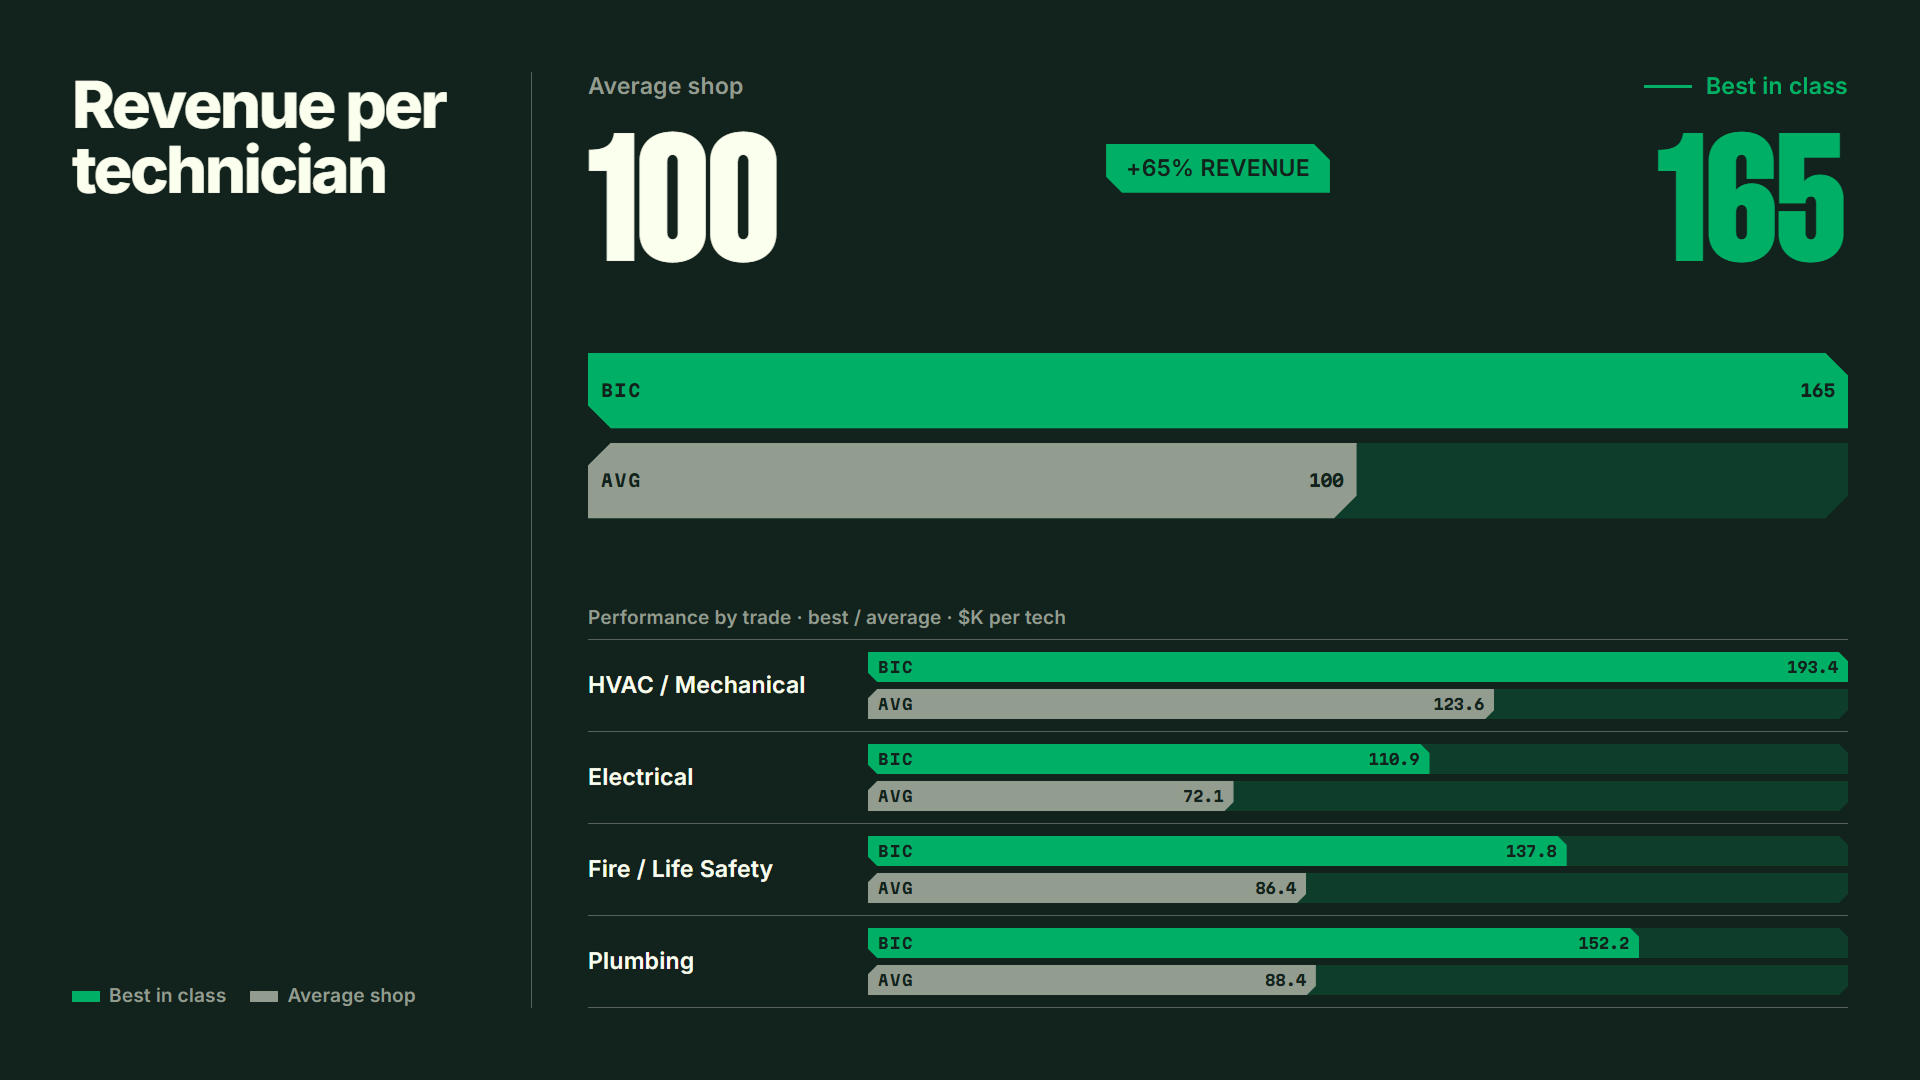
The benchmark puts that improvement in context: contractors in the top 20% generate 65% more revenue per technician, same headcount, better-utilized hours. They also close jobs in 11.2 days vs. the platform average of 21.6.
The gap is not about effort. It is about what is in the technician's hand when they show up: job history, equipment info, pricing, and parts visibility, all where the work happens. That context helps explain why the top 20% can move more work through the same number of people.
Revenue growth
The impact of those operational improvements ultimately shows up in growth.
Rolls Mechanical reported 44% revenue growth in its first year on BuildOps: “and year to date, we're at 60% growth,” says Karly Rolls Hoen, VP at Rolls.
For Classic Electric, the benefit has been less about one isolated metric and more about creating time to focus on what matters.
“I would definitely recommend BuildOps if you want to free up some time and scale your business.”
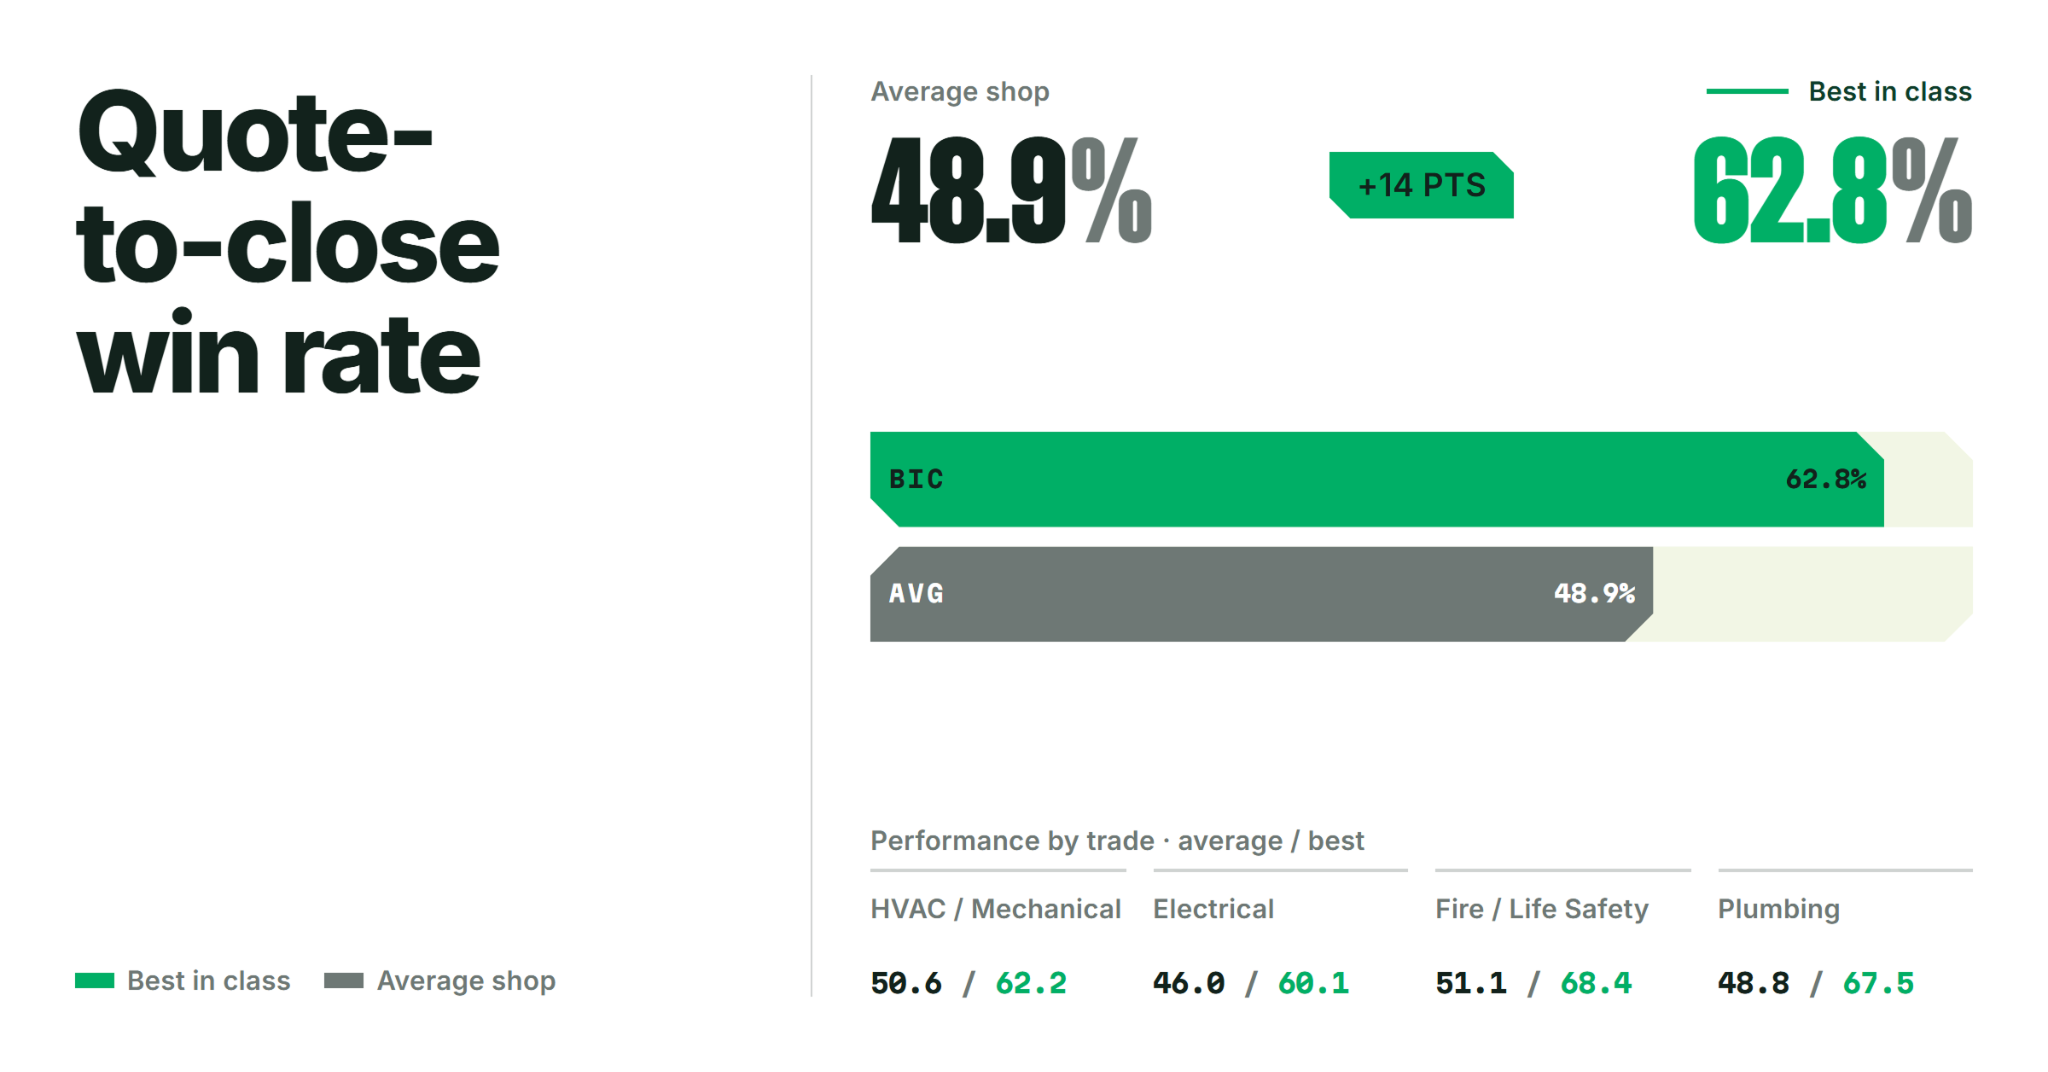
The benchmark shows a similar advantage in sales execution: the top contractors convert 62.8% of quotes into won work vs. 48.9% at the platform average—a 14-point improvement.
The through line across all three areas is execution. When information is ready, work moves faster; when work moves faster, contractors have more opportunities to bill, close, and grow. Speed wins, and the contractor who quotes first, with the right context, closes more.
Where does your shop stand?
The top 20% collect 41 days faster and generate 65% more revenue per technician. But these benchmarks are not a single pass/fail score. Each one is measured independently, so you might lead on one and have room to close on another.
The useful question is where your shop can gain ground first.
Check out the Value Calculator to compare your numbers with what is shaping the top of the field.