How $100K in Billable Work Disappears When Nobody Is Tracking It
When the field, office, and billing process are working from the same information, there's less waiting, less chasing, and less opportunity for completed work to disappear between one step and the next.

A contractor can lose $100,000 without losing a single job. That sounds impossible until you look at how money actually moves through a commercial contracting business.
In the field:
- A technician completes the work;
- Materials are used;
- A change is made;
- Someone takes photos and writes notes; and
- The job gets marked complete.
As that information moves from the field to the office, something goes missing.
- The work order never gets closed.
- The documentation sits in someone's inbox.
- A material charge never makes it onto the invoice.
- A change order gets discussed but not captured.
- The invoice goes out, but nobody notices it is sitting unpaid for another 60 days.
None of those problems look like a six-figure disaster on its own. That’s exactly why they’re dangerous.
But $100k in billable work disappearing is exactly what can happen when a business is unable to reliably track the handoffs that turn completed work into collected revenue.
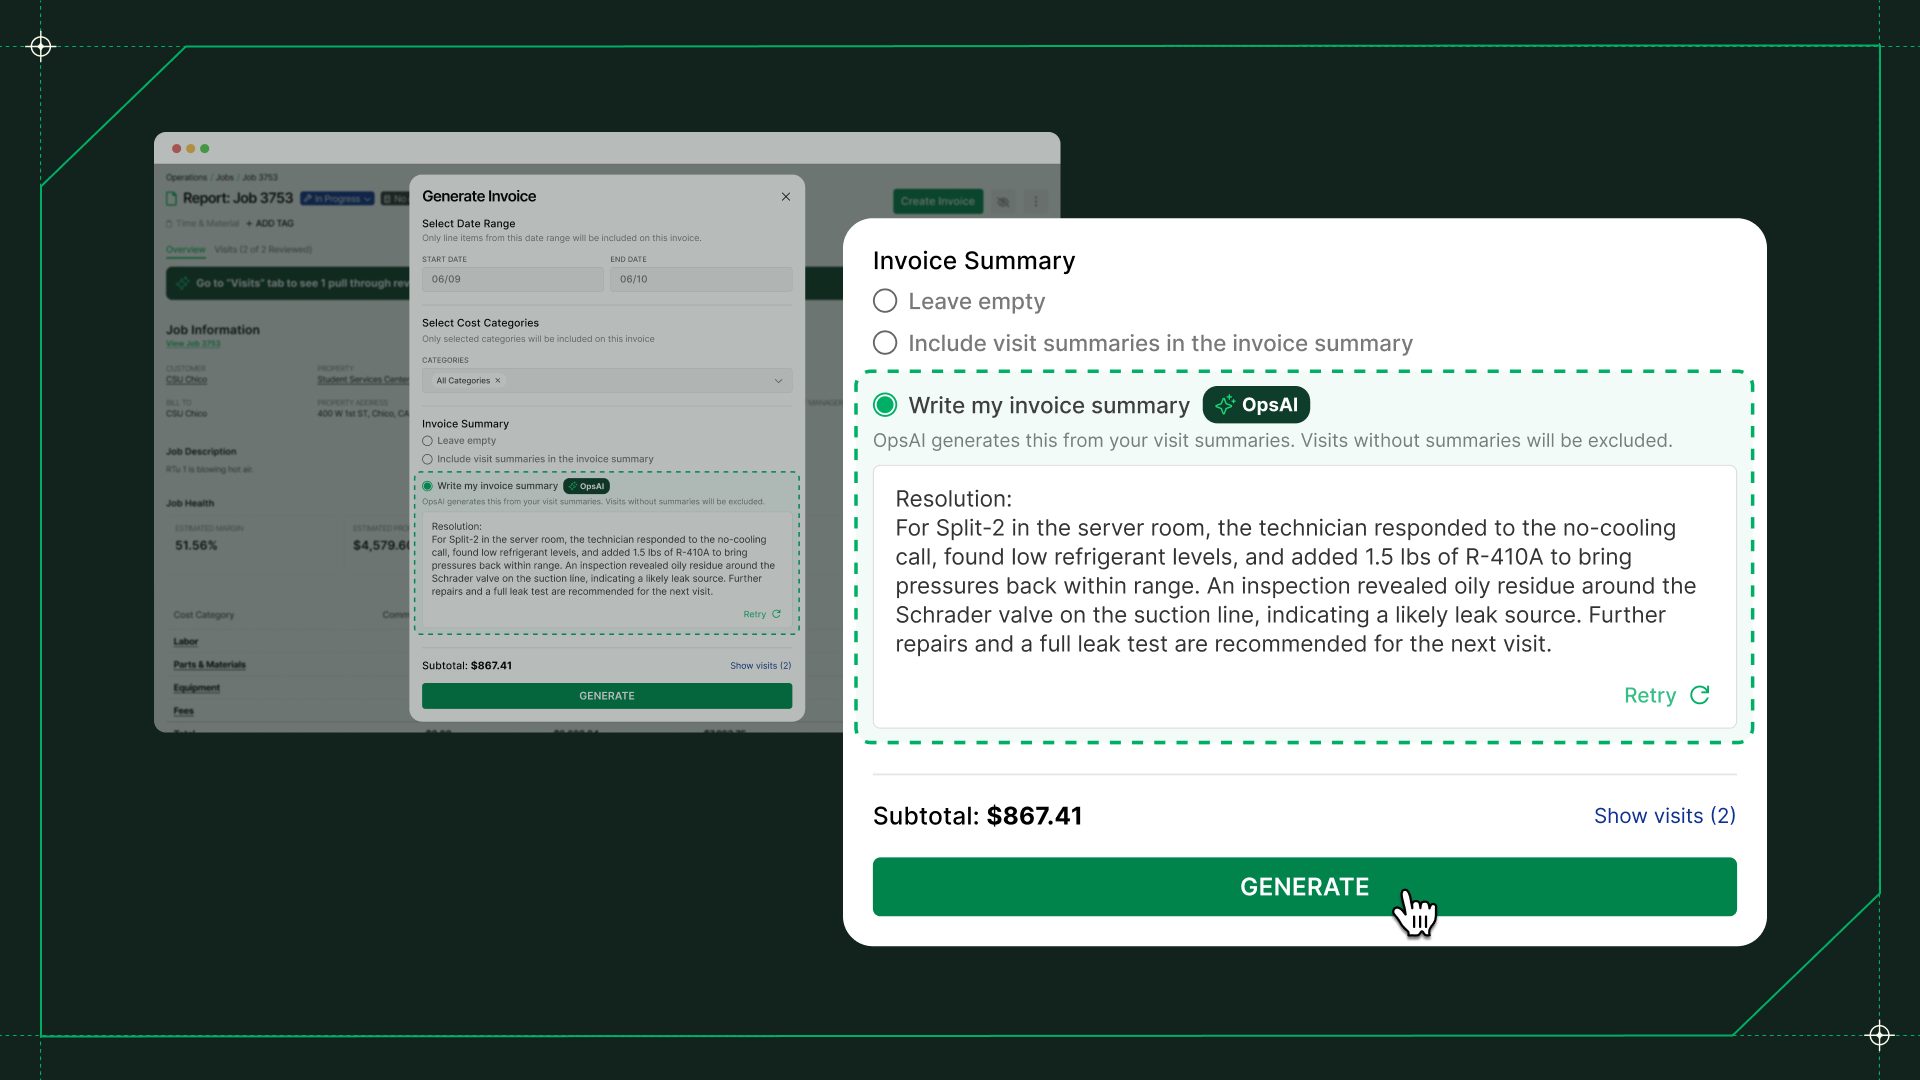
Understand documentation and billing processes
The first place to look for revenue slipping through the cracks is work completed versus work invoiced. Out of 500 jobs completed last month:
- How many of those jobs became invoices?
- How many are still sitting open?
- How many have been waiting on documentation, approvals, purchase orders, or someone's attention?
Those factors matter because completed work only becomes revenue when the information surrounding it keeps moving.
Torque 2026, the first edition of BuildOps’ annual Commercial Contractor Benchmark Report, compares performance across more than 1,500 commercial contractors and measures the average contractor against the top-performing 20% across nine operational and financial benchmarks.
One of the clearest differences shows up in service days sales outstanding (DSO). The average contractor takes 66.4 days to collect payment on service work, while best-in-class contractors are at 25.2 days.
The report points to documentation and billing processes as common sources of the problem. When technicians leave without complete notes, photos, signatures, or PO numbers, invoices can get delayed. The work is finished, but the revenue is not moving at the same speed.
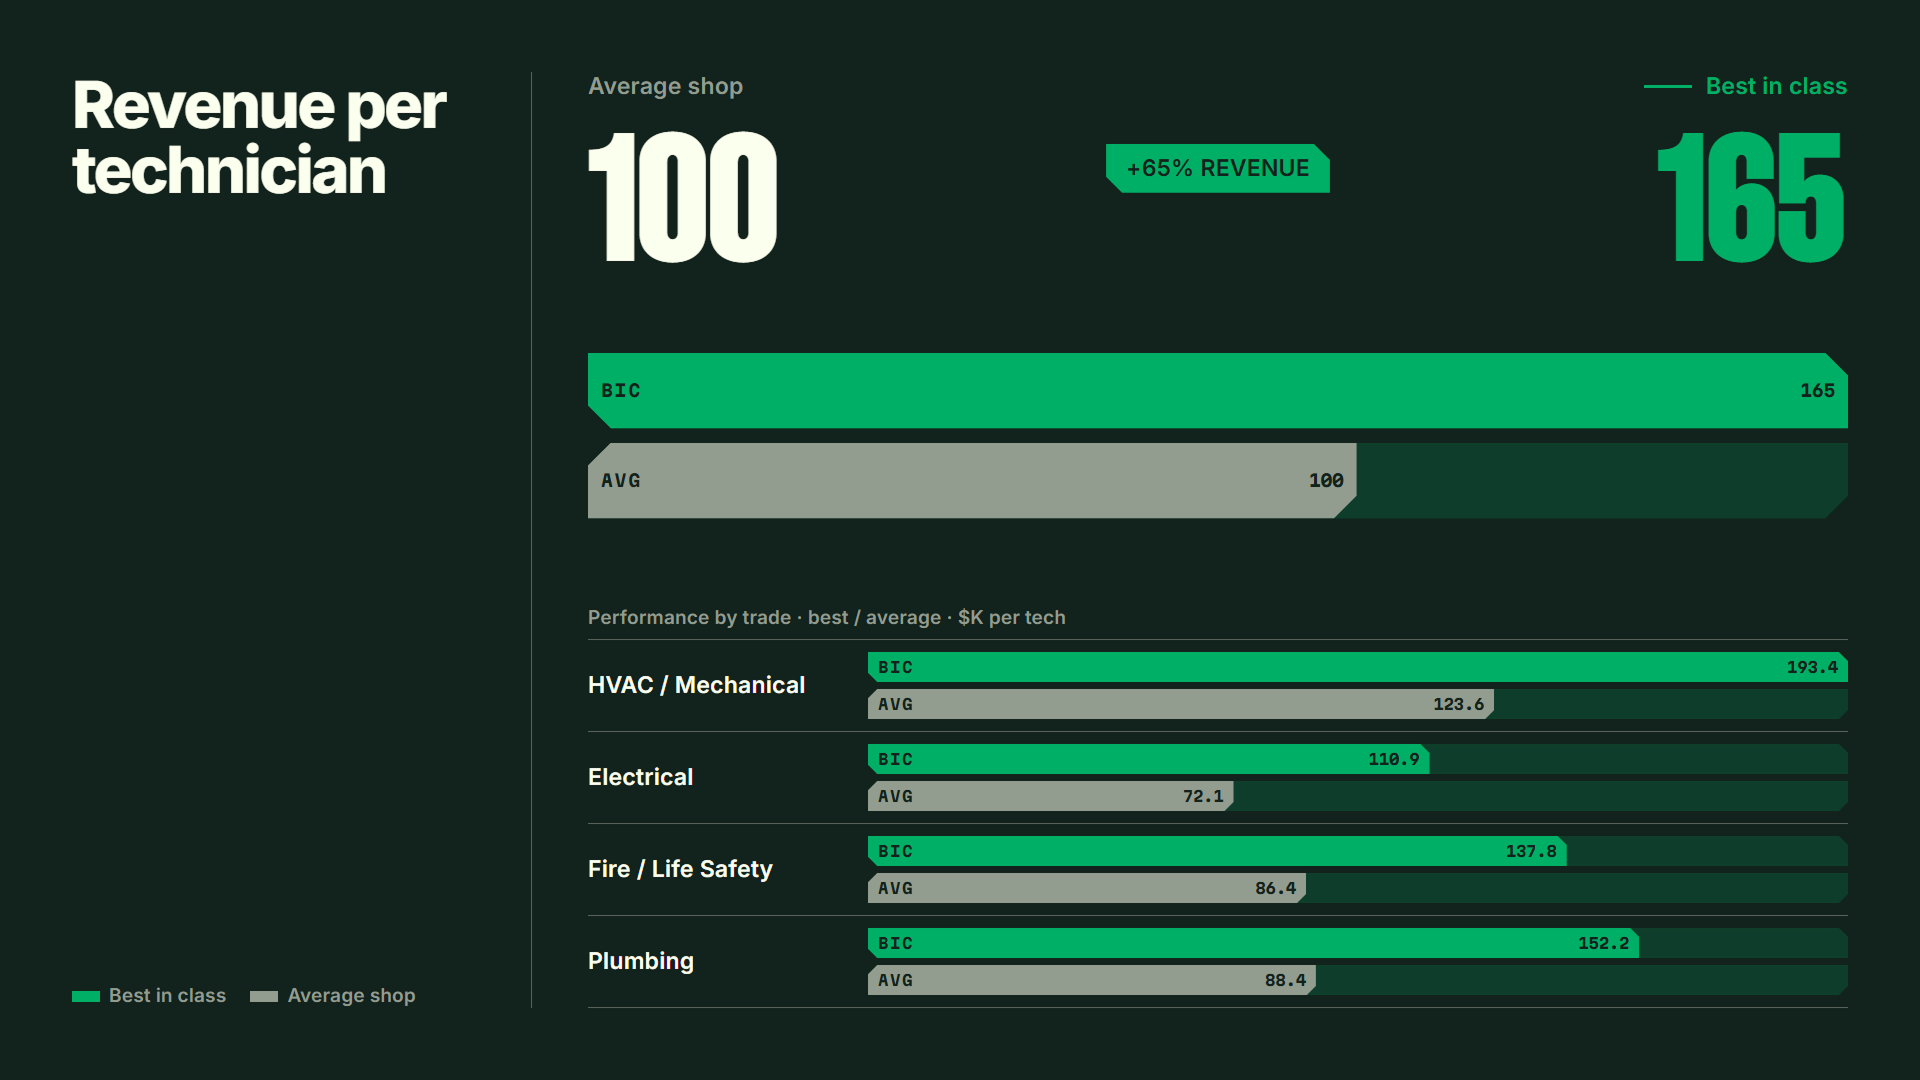
The report's revenue-per-technician benchmark tells a similar story from the field.
- Best-in-class contractors generate 65% more revenue per technician than the average contractor.
- HVAC/mechanical revenue per technician is $123.6K compared with $193.4K for best-in-class contractors.
- Electrical averages $72.1K compared with $110.9K at best-in-class shops.
Not that every contractor should match those numbers tomorrow. But the gap between average and best-in-class is measurable, and the same is true inside your own operation.
Self-audit by following the handoffs
A good self-audit starts by following one completed job all the way through the business.
1. Start with the field.
Work completed vs. work invoiced: Take a sample of recently completed work orders and compare them with invoices generated. Any mismatch should have an explanation and, more importantly, an owner.
2. Look at the next handoff.
Invoiced work vs. payments received: How long does it typically take to move from invoice creation to payment? If the answer is longer than it should be, determine whether the problem is collections or whether factors earlier in the process are slowing things down.
The Torque 2026 makes that distinction important. The report says a rising DSO can be an early symptom of documentation and billing process breakdowns, showing up before the problem reaches the P&L.
3. Follow the materials.
Materials used vs. materials captured: A technician uses a part. A project manager approves a purchase. A change is made because the conditions in the field are different from the original scope. Are those costs reliably connected to the job? If they are not, the business can end up paying for work it never fully bills.
The same goes for change orders. If a scope change lives in a text message, email thread, handwritten note, or someone's memory, it is remarkably easy for that revenue to disappear before it ever becomes an invoice.
4. Review project documentation.
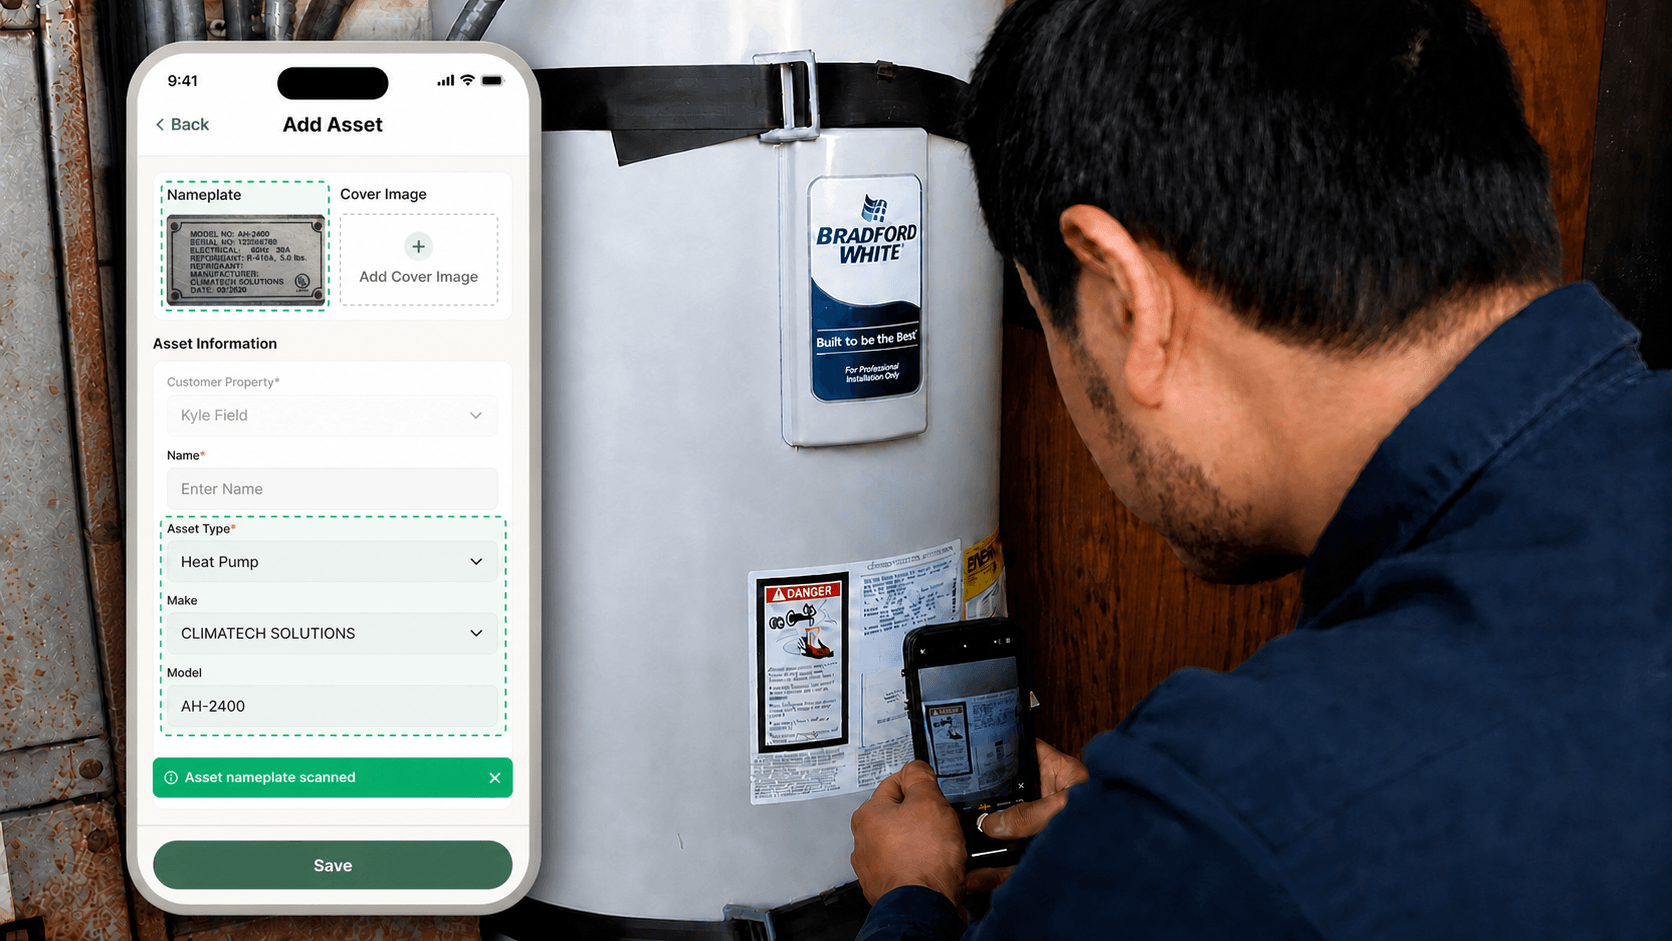
Technician data vs. what billing actually receives: A technician may have spent 10 minutes documenting exactly what happened on a job with photos and notes. That information has value only if the office sees and acts on it. A structured work order closeout process helps ensure field information does not stop with the technician.
Commonly, field employees are willing to provide information when they can see that the information is actually used and valued. When information disappears into a black hole, the effort seems pointless. If the effort does not seem worth the hassle:
- The field team provides less information because they do not trust the process.
- The office has less information to bill and manage the work.
- Leadership receives less reliable data to make decisions.
- The business becomes increasingly dependent on phone calls, spreadsheets, memory, and tracking people down.
Don’t let small gaps become big problems
The most important discrepancies are small and may not look impressive individually.
- Missing material charges
- Delayed invoices
- A change order that never gets approved
- A callback that consumes another technician's time.
- A warranty visit that nobody properly attributes.
- A credit that gets issued because the original documentation was unclear.
Collectively, those seemingly small issues can become a serious margin problem. They become revenue left behind that shows up as lower profit, thinner margins, slower cash, or a month that somehow did not produce the expected results.
Top performers don’t simply work their technicians harder. Instead, it’s the system around the technician that makes the difference in improving efficiency and streamlining workflows.
The same principle applies to revenue leakage. When information moves slowly or incompletely, somebody eventually pays for it, whether it’s the:
- Technician whose time gets wasted;
- The office employee who has to track down missing information; or
- The contractor who never invoices the full value of the work.
Torque 2026 found that best-in-class contractors:
- Review aging receivables weekly;
- Use live field information to support billing; and
- Keep documentation moving with the work rather than allowing it to pile up behind it.
As a result, best-in-class contractors close jobs in an average of 11.2 days, compared with 21.6 days for the average contractor. They also complete 1.55 work orders per technician per day versus 1.16 for the average shop.
Those numbers are connected. When the field, office, and billing process are working from the same information, there is less waiting, less chasing, and less opportunity for completed work to disappear between one step and the next.
Expose the $100K problem hiding in plain sight
The hardest revenue leaks to find are the ones that never look serious on their own.
- A completed job that sits unbilled.
- A material charge that never makes it onto the invoice.
- A change order that loses momentum.
- A payment that takes another few weeks to arrive.
Multiply those small gaps across hundreds or thousands of jobs, and the impact can become substantial before anyone notices.
The Torque 2026 gives contractors a way to compare their performance across nine operational and financial metrics, including:
- Cash velocity;
- Field productivity;
- Office efficiency; and
- Revenue growth.
Each benchmark is measured against the top-performing 20% of BuildOps customers.
The goal is not to chase someone else's numbers, but to understand where your own operation is losing time, capacity, or cash. And then to close the gaps before small leaks become six-figure problems.

.png)