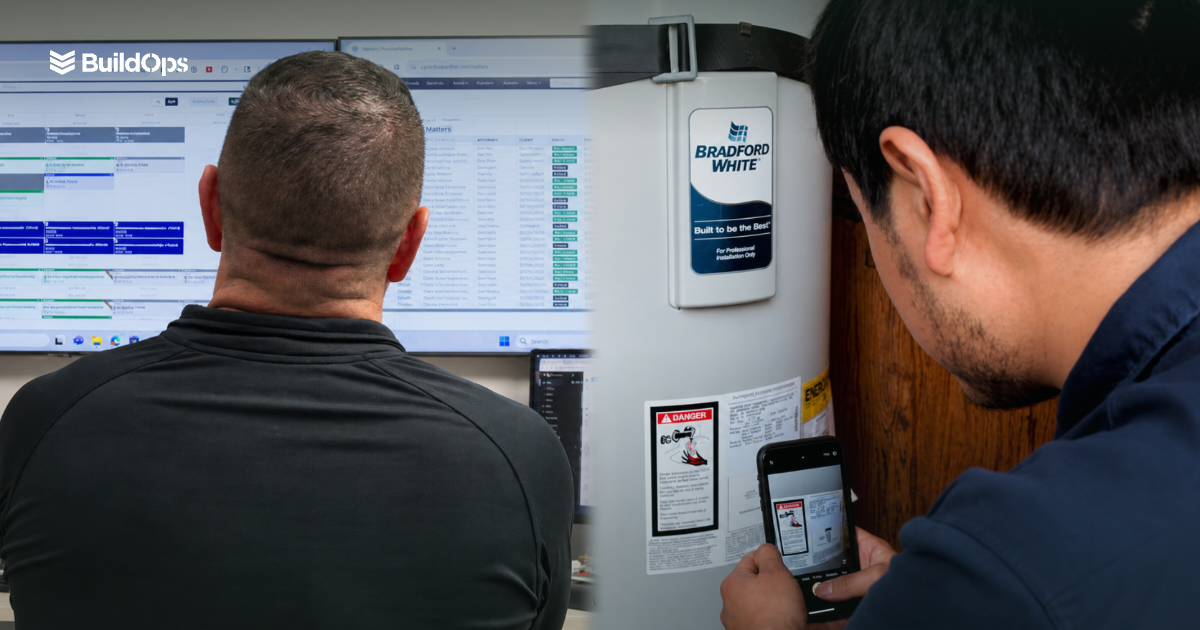
Same Crew. 65% More Revenue from Every Technician
Revenue per technician is the cleanest single measure of how much billable output your field actually produces in a year.
If you run a commercial contracting business today, you don’t have unlimited options.
You can’t magically double the number of experienced technicians in your market. You can’t slow down wage inflation. And you can’t bill for hours that never make it out of the truck.
What you can do is change how much revenue each technician produces.
Across the BuildOps platform, best‑in‑class contractors generate about 65% more revenue per technician than the average shop. Same market, same labor pool, different output per head.
For owners and presidents, that’s the lever that actually moves the P&L: field productivity is a system decision, not a people problem.
The revenue-per-tech gap: why the same crew produces very different revenue
Revenue per technician is the cleanest single measure of how much billable output your field actually produces in a year.
Our Benchmark Report: Torque 2026 shows three things very clearly:
The North American industry benchmark for revenue per technician in commercial service businesses is about $207,000 per tech.
- Most of the gap between average and best‑in‑class is not headcount, it’s how each crew’s time is used and supported.
- The contractors at the top of the chart don’t have larger crews, they have better‑utilized ones.
They’ve done three things owners care about:
- Turned technician time into a protected asset, not a flexible buffer.
- Closed the gap between the field and the office so work can be billed, and collected, fast.
- Let the platform, not more coordinators, handle the day‑to‑day orchestration.
That’s how you end up with the same crew and dramatically more revenue.
The compounding math of 20 “lost” minutes
In almost every operation, there’s a familiar pattern: no one can point to a single hour‑long block of wasted time. What they do see is 10 minutes here, 15 minutes there.
Pull that into the open with a simple thought experiment:
- A technician loses just 20 minutes a day to paperwork, parts lookups, or office calls.
- Over a working year, that’s roughly 85 hours of potential billable time per tech.
- At a $150 blended billable rate, that’s about $12,750 in annual revenue capacity per technician.
- On a 20‑tech crew, you’re looking at ~$255,000 in additional revenue if you can recover and sell that time.
Even if you haircut that to a more conservative realized figure – say $187,000 per year – it’s still six figures of revenue tied up in everyday friction.
That’s the invisible drag best‑in‑class operators remove. And it’s exactly the shift Jolma Electric made.
Jolma Electric: treating technician time like your scarcest resource
Jolma Electric is a commercial electrical contractor that decided to attack the problem at the system level instead of asking their techs to “work harder.”
They were living the same story most owners recognize:
- Techs calling the office from the jobsite to get history, pricing, or equipment details.
- Paper notes and photos that had to be chased days later so billing could go out.
- Crews stuck waiting on parts that weren’t staged before arrival.
All of that time showed up in one line on the P&L: lower revenue per technician.
On BuildOps, they flipped the model:
- The mobile field app put job history, site photos, equipment records, and live pricing in their electricians’ hands on‑site – no more calling the office for information that should already be there.
- OpsAI began drafting visit summaries from field notes, so documentation was complete before the truck left the jobsite.
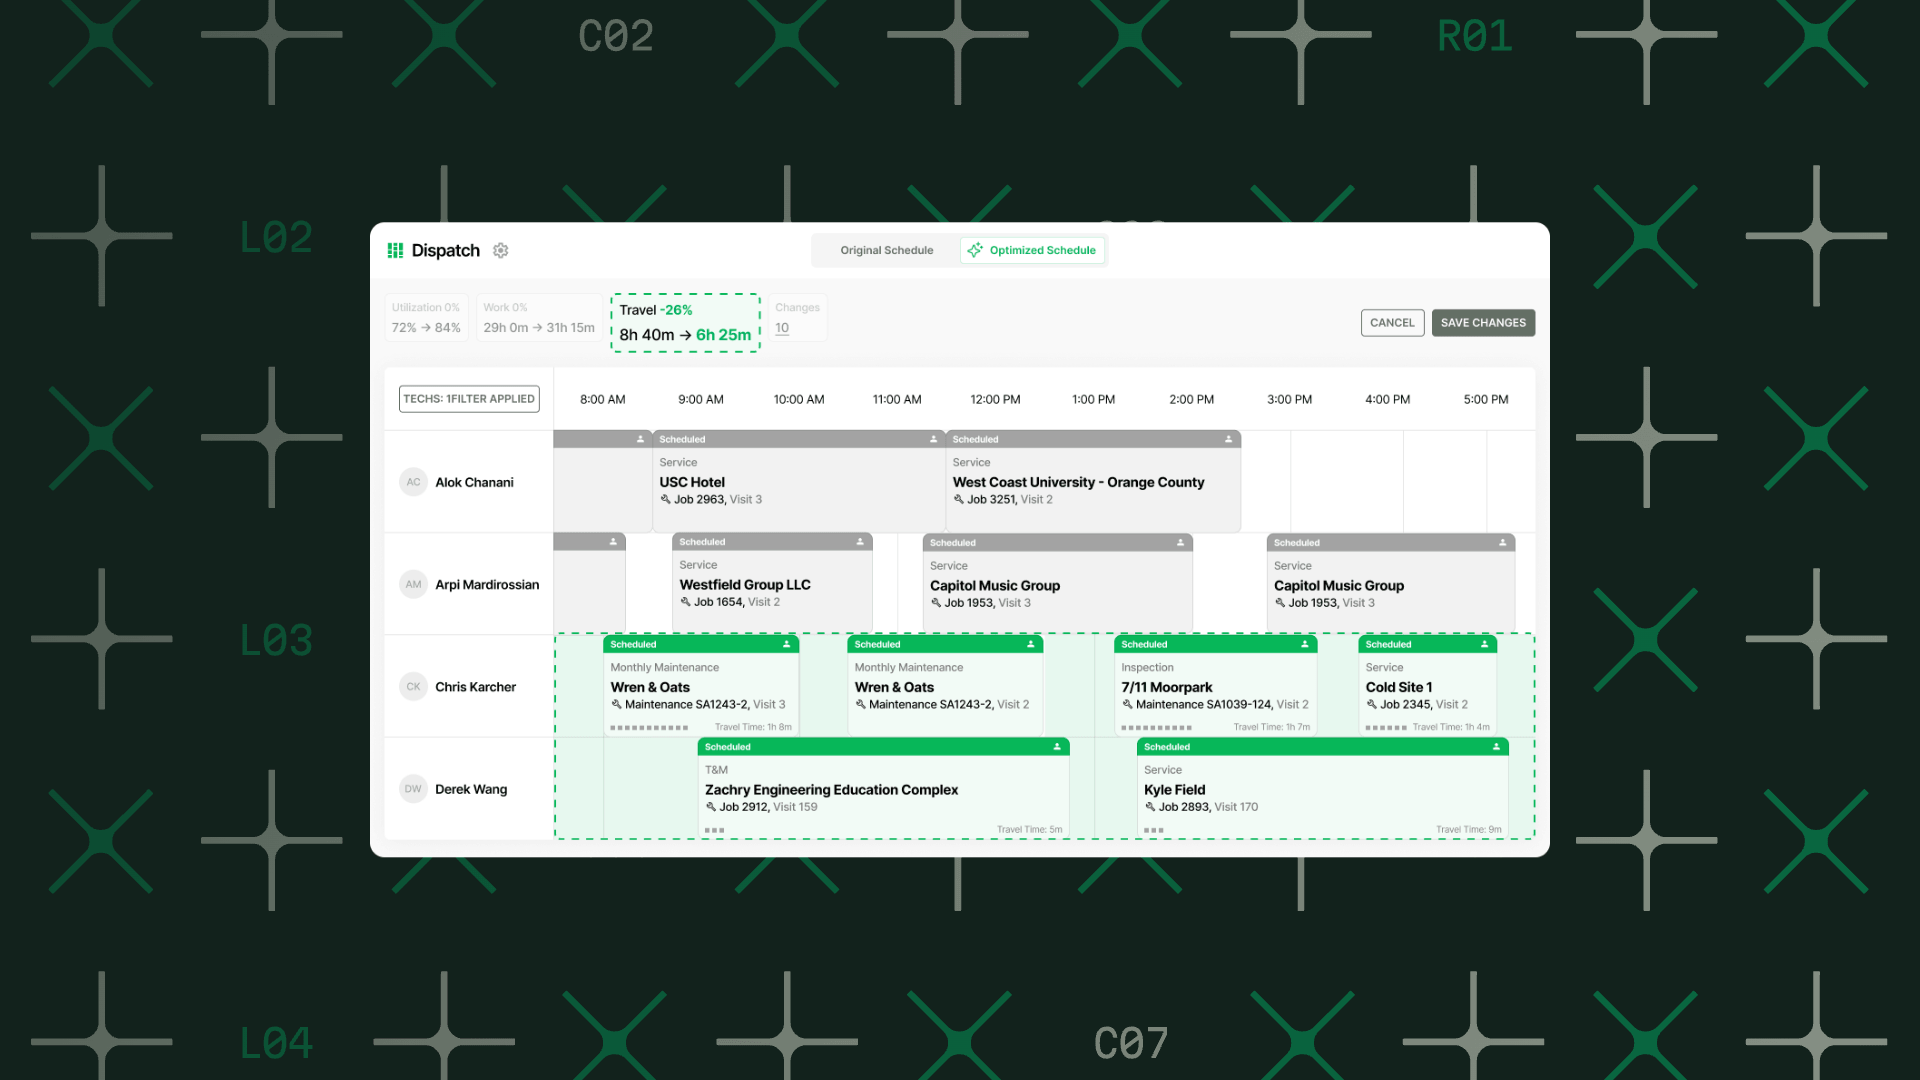
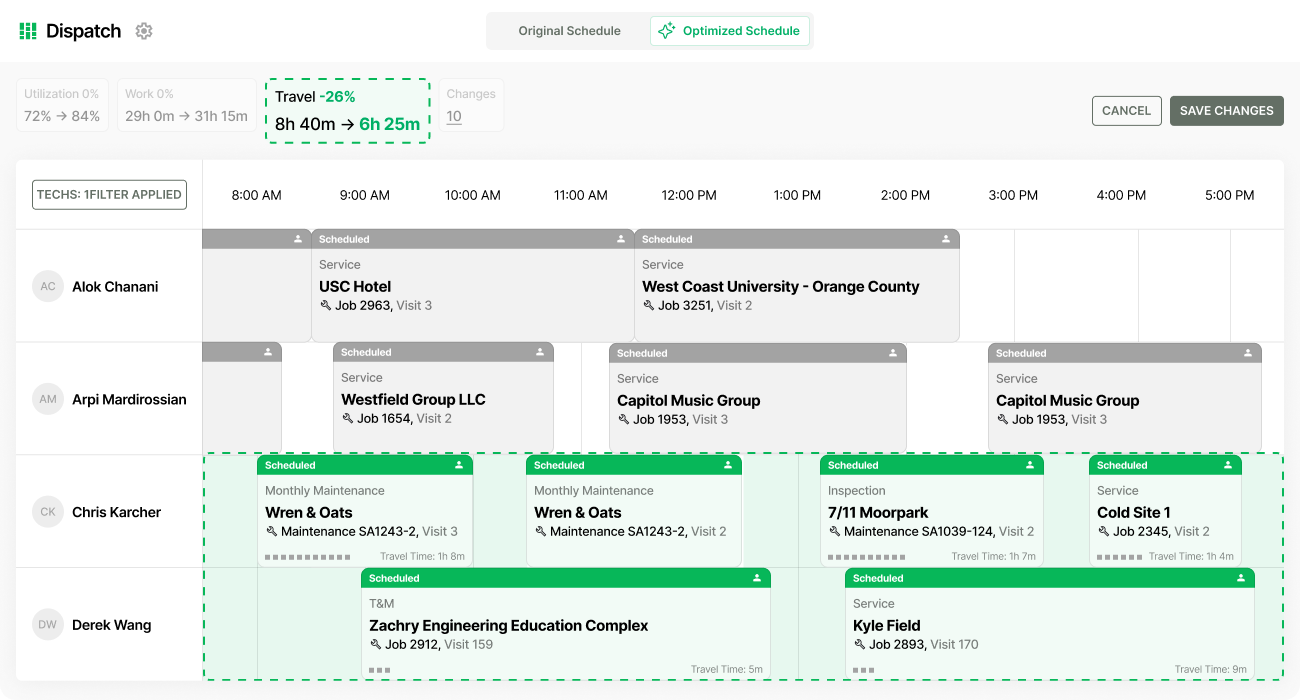
- Smart Dispatch started matching the right technician to the right job based on skills, location, and workload – cutting down windshield time and no‑shows.
- Integrated parts and inventory visibility reduced truck rolls for missing materials – one of the biggest hidden productivity leaks in field service.
In Jolma’s own words, “Even 15 minutes a day per crew adds up to hundreds of thousands of dollars over a year.”
The result: Jolma grew revenue per technician by 139% without ballooning headcount. Same crews. Very different output.
For an owner, that’s not a nice‑to‑have improvement – it’s a different business.
The system behind more revenue with the same crew
Owners who unlock Jolma‑level results make a few concrete system shifts.
1. Make revenue per tech and utilization core KPIs
They stop judging technicians purely on total revenue or “number of calls” and start tracking:
- Revenue per technician
- Billable share of the paid day (utilization) – with 85%+ as the target
- Work orders completed per tech per day
That lens makes it very obvious where the day is leaking: drive time, callbacks, parts delays, or admin.
2. Close the field-to-office gap
Long Days Sales Outstanding (DSO) and low revenue per tech are usually documentation and process problems, not collections problems.
Best‑in‑class contractors:
- Enforce required digital fields at job close so techs capture notes, photos, signatures, and PO numbers while they’re still on site.
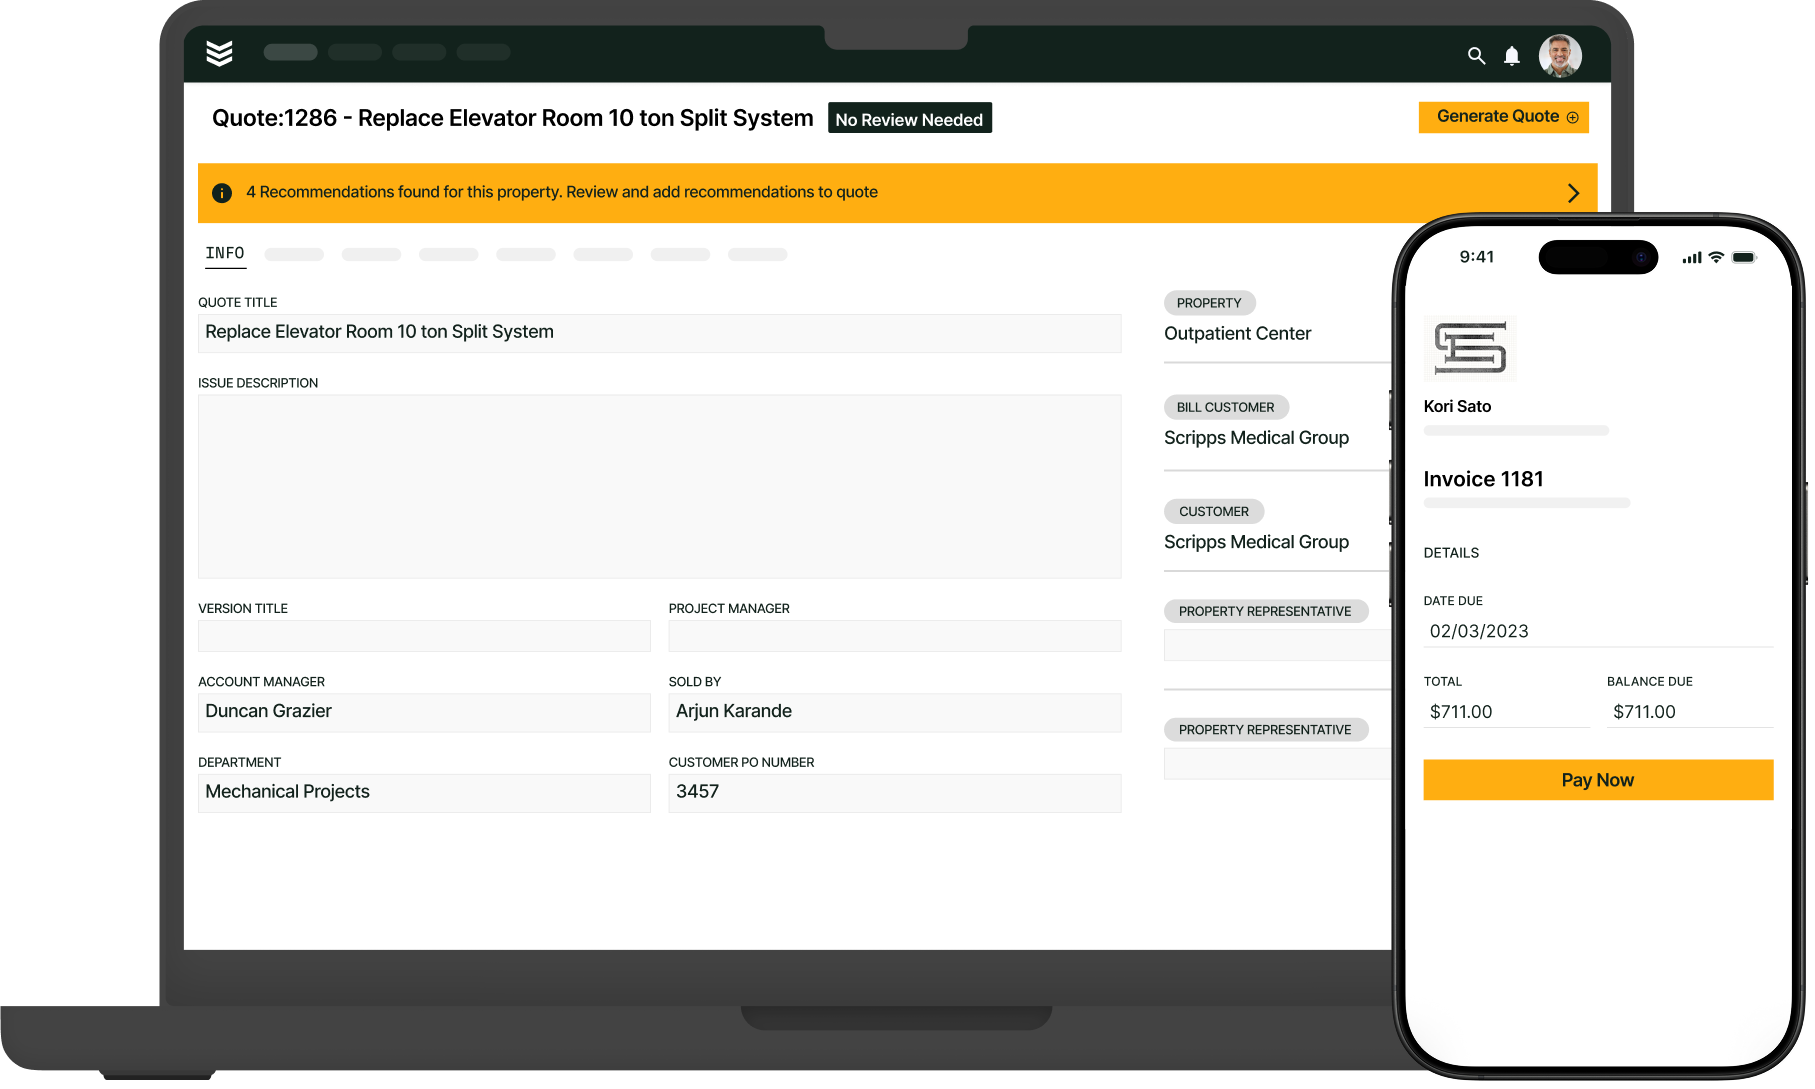
- Trigger invoices automatically on job completion instead of batching billing once or twice a week.
- Use tools like Revenue Finder to surface completed work that hasn’t been billed yet.
That’s how they collect in 25 days instead of 66 on service work, and 29 days instead of 68 on projects – and why cash hits the bank while the work is still fresh in the customer’s mind.
3. Let the platform do the coordination the office used to do by hand
In a manual operation, every new technician means more scheduling work, more billing work, more spreadsheet work.
Best‑in‑class operators break that link by:
- Running dispatch, field operations, and billing on one platform – no re‑entry between systems.
- Using Smart Dispatch to optimize routing and skills‑to‑job matching.
- Leaning on OpsAI to automate visit recaps, purchasing‑document capture, and invoice generation.
That’s how they get to a 6.75:1 technician‑to‑back‑office ratio instead of 4.77:1. Every avoided admin hire is $60K‑$80K of operating profit protected.
See where your crew stands
The difference between “same crew, same results” and “same crew, 65% more revenue per tech” is whether you choose to treat field productivity as a strategic lever.
If you want to see what that could look like in your own numbers, start with the benchmarks.